> ## Documentation Index
> Fetch the complete documentation index at: https://aegean.ai/llms.txt
> Use this file to discover all available pages before exploring further.
# Creating Diagrams as Code
> How to create architecture diagrams programmatically using Python's diagrams package and Mermaid.
Creating diagrams programmatically offers significant advantages over manual drawing tools: version control, reproducibility, and consistency across documentation. This tutorial covers two approaches for creating diagrams as code.
## Python Diagrams Package
The [diagrams](https://diagrams.mingrammer.com/) Python package allows you to draw cloud system architecture diagrams using Python code. It supports major cloud providers (AWS, Azure, GCP), on-premise infrastructure, and custom icons.
### Installation
```bash theme={null}
pip install diagrams
```
You also need [Graphviz](https://graphviz.org/) installed and available on your PATH.
### AWS Architecture Example
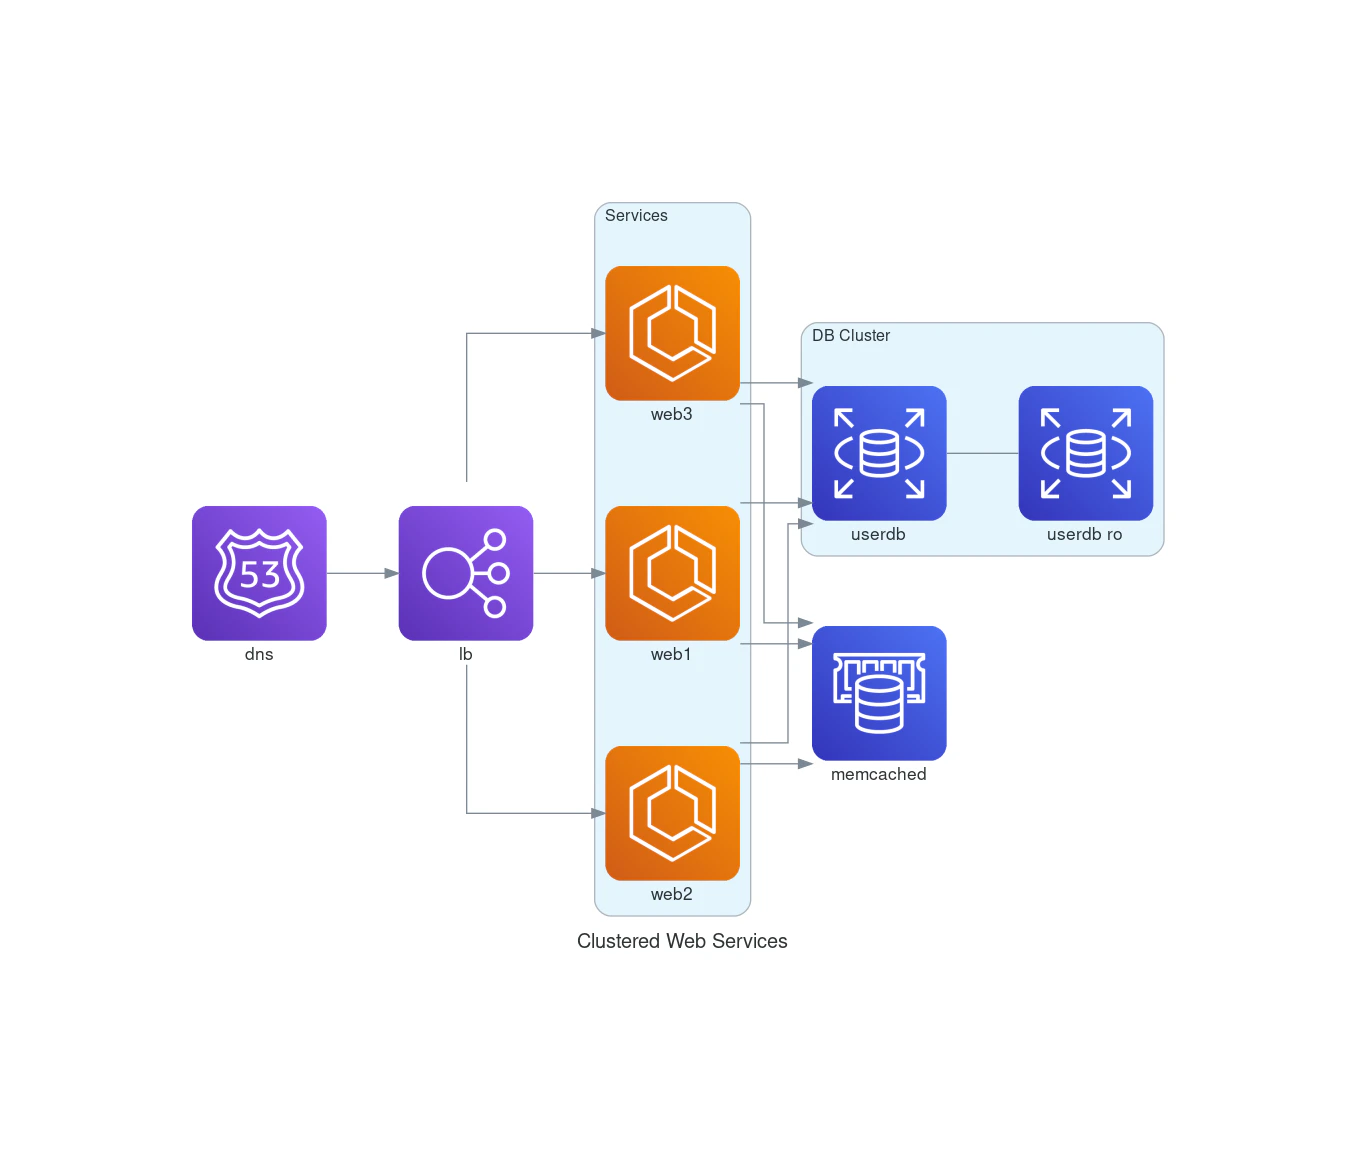
Here's how to create a clustered web services diagram:
```python theme={null}
from diagrams import Cluster, Diagram
from diagrams.aws.compute import ECS
from diagrams.aws.database import ElastiCache, RDS
from diagrams.aws.network import ELB, Route53
with Diagram("Clustered Web Services", show=False) as diag:
dns = Route53("dns")
lb = ELB("lb")
with Cluster("Services"):
svc_group = [ECS("web1"), ECS("web2"), ECS("web3")]
with Cluster("DB Cluster"):
db_primary = RDS("userdb")
db_primary - [RDS("userdb ro")]
memcached = ElastiCache("memcached")
dns >> lb >> svc_group
svc_group >> db_primary
svc_group >> memcached
```
 ### C4 Model Diagrams
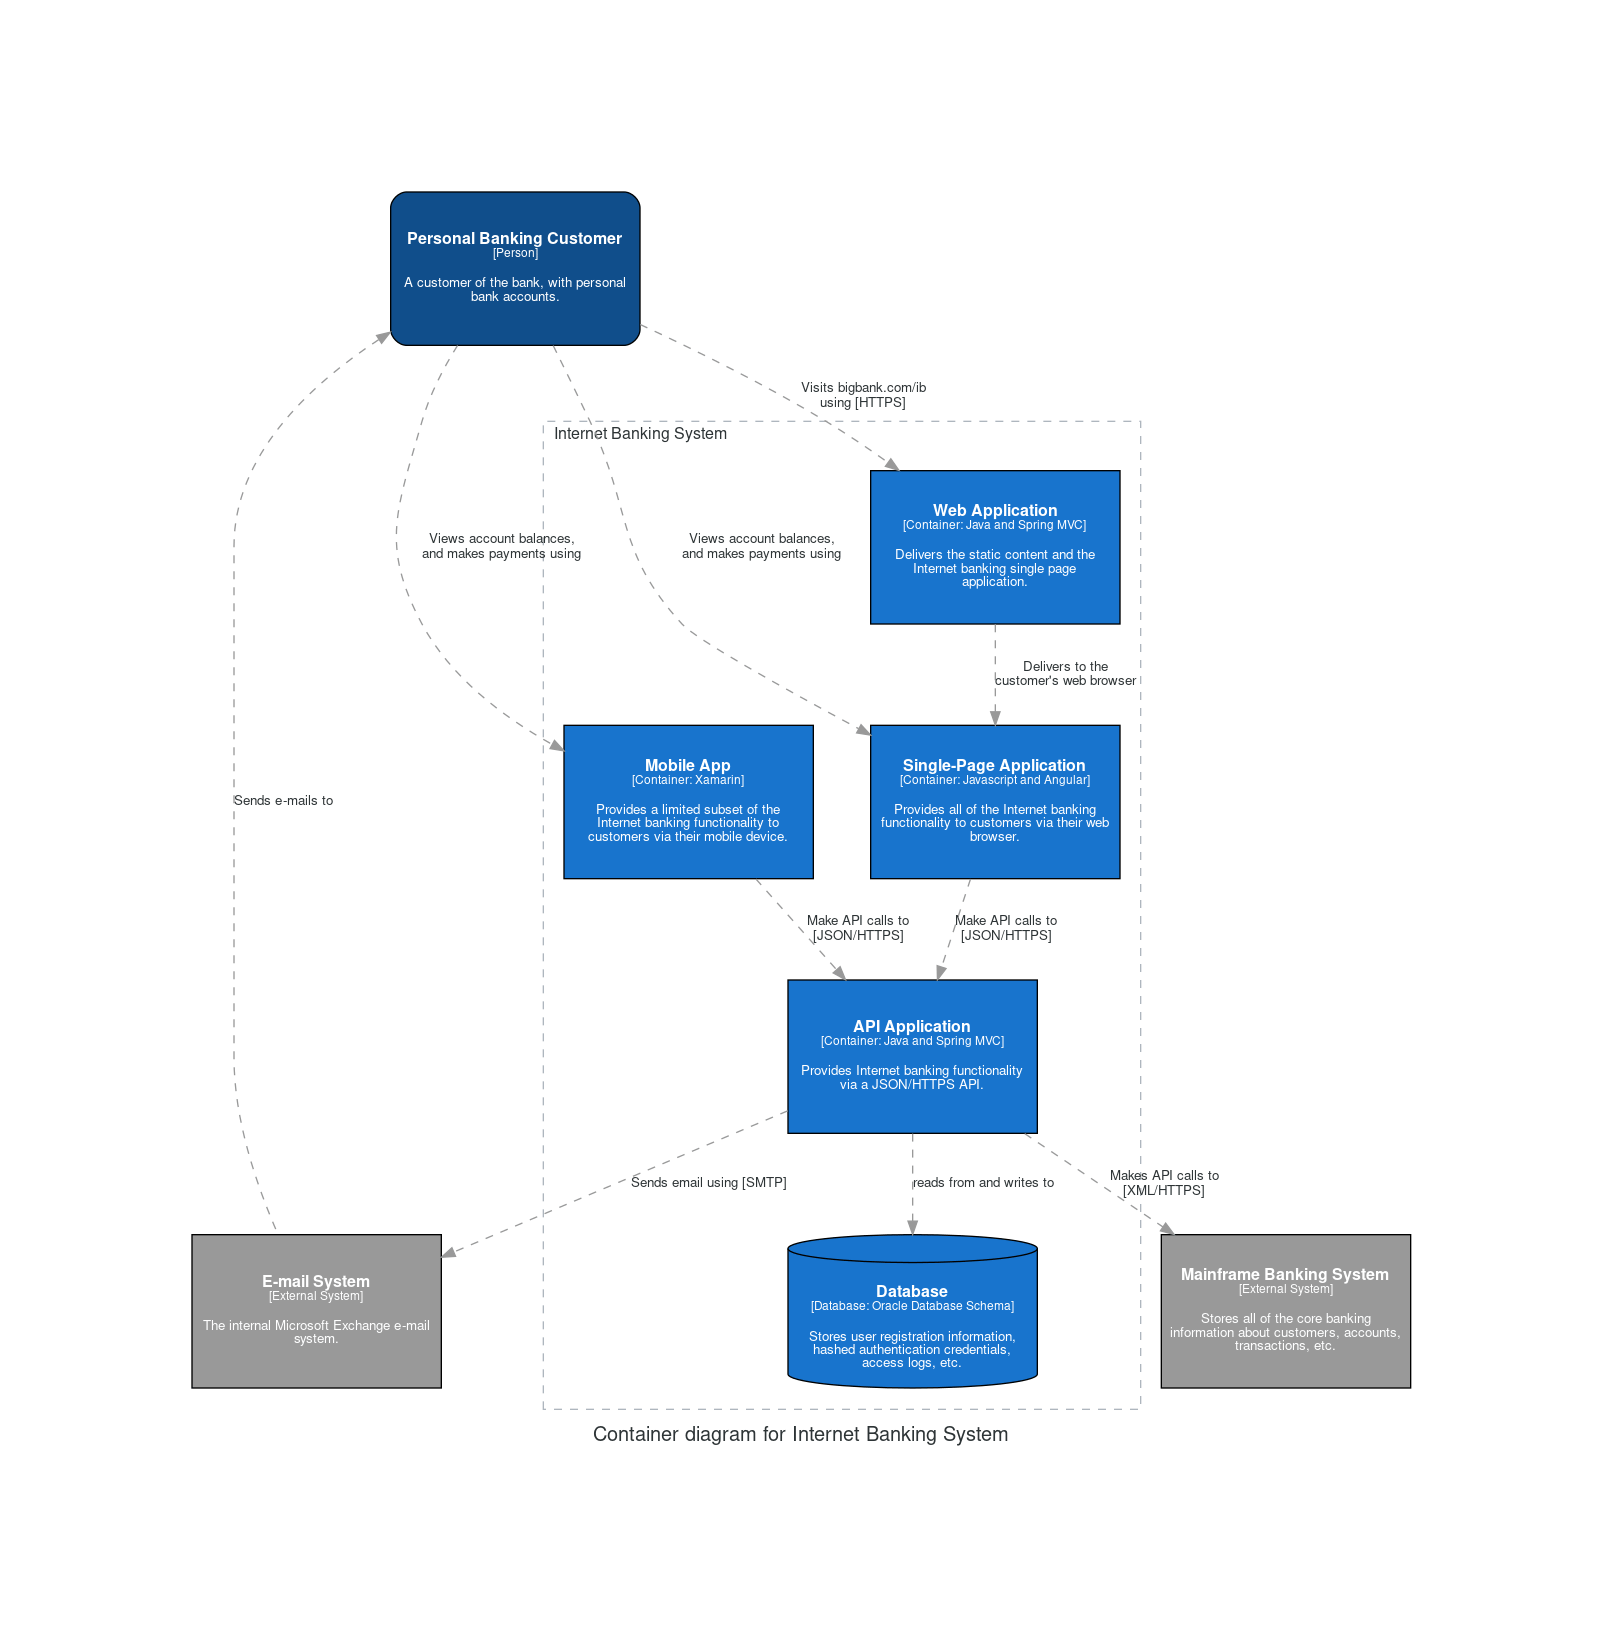
The diagrams package supports the C4 model for visualizing software architecture:
```python theme={null}
from diagrams import Diagram
from diagrams.c4 import Person, Container, Database, System, SystemBoundary, Relationship
with Diagram("Container diagram for Internet Banking System", direction="TB") as diag:
customer = Person(
name="Personal Banking Customer",
description="A customer of the bank, with personal bank accounts."
)
with SystemBoundary("Internet Banking System"):
webapp = Container(
name="Web Application",
technology="Java and Spring MVC",
description="Delivers the static content and the Internet banking SPA.",
)
spa = Container(
name="Single-Page Application",
technology="Javascript and Angular",
description="Provides Internet banking functionality via web browser.",
)
api = Container(
name="API Application",
technology="Java and Spring MVC",
description="Provides Internet banking functionality via JSON/HTTPS API.",
)
database = Database(
name="Database",
technology="Oracle Database Schema",
description="Stores user registration, credentials, access logs.",
)
email = System(name="E-mail System", external=True)
mainframe = System(name="Mainframe Banking System", external=True)
customer >> Relationship("Visits using [HTTPS]") >> webapp
customer >> Relationship("Views and makes payments") >> spa
webapp >> Relationship("Delivers to browser") >> spa
spa >> Relationship("API calls [JSON/HTTPS]") >> api
api >> Relationship("reads/writes") >> database
api >> Relationship("Sends email [SMTP]") >> email
api >> Relationship("API calls [XML/HTTPS]") >> mainframe
```
### C4 Model Diagrams
The diagrams package supports the C4 model for visualizing software architecture:
```python theme={null}
from diagrams import Diagram
from diagrams.c4 import Person, Container, Database, System, SystemBoundary, Relationship
with Diagram("Container diagram for Internet Banking System", direction="TB") as diag:
customer = Person(
name="Personal Banking Customer",
description="A customer of the bank, with personal bank accounts."
)
with SystemBoundary("Internet Banking System"):
webapp = Container(
name="Web Application",
technology="Java and Spring MVC",
description="Delivers the static content and the Internet banking SPA.",
)
spa = Container(
name="Single-Page Application",
technology="Javascript and Angular",
description="Provides Internet banking functionality via web browser.",
)
api = Container(
name="API Application",
technology="Java and Spring MVC",
description="Provides Internet banking functionality via JSON/HTTPS API.",
)
database = Database(
name="Database",
technology="Oracle Database Schema",
description="Stores user registration, credentials, access logs.",
)
email = System(name="E-mail System", external=True)
mainframe = System(name="Mainframe Banking System", external=True)
customer >> Relationship("Visits using [HTTPS]") >> webapp
customer >> Relationship("Views and makes payments") >> spa
webapp >> Relationship("Delivers to browser") >> spa
spa >> Relationship("API calls [JSON/HTTPS]") >> api
api >> Relationship("reads/writes") >> database
api >> Relationship("Sends email [SMTP]") >> email
api >> Relationship("API calls [XML/HTTPS]") >> mainframe
```
 ### Custom Icons
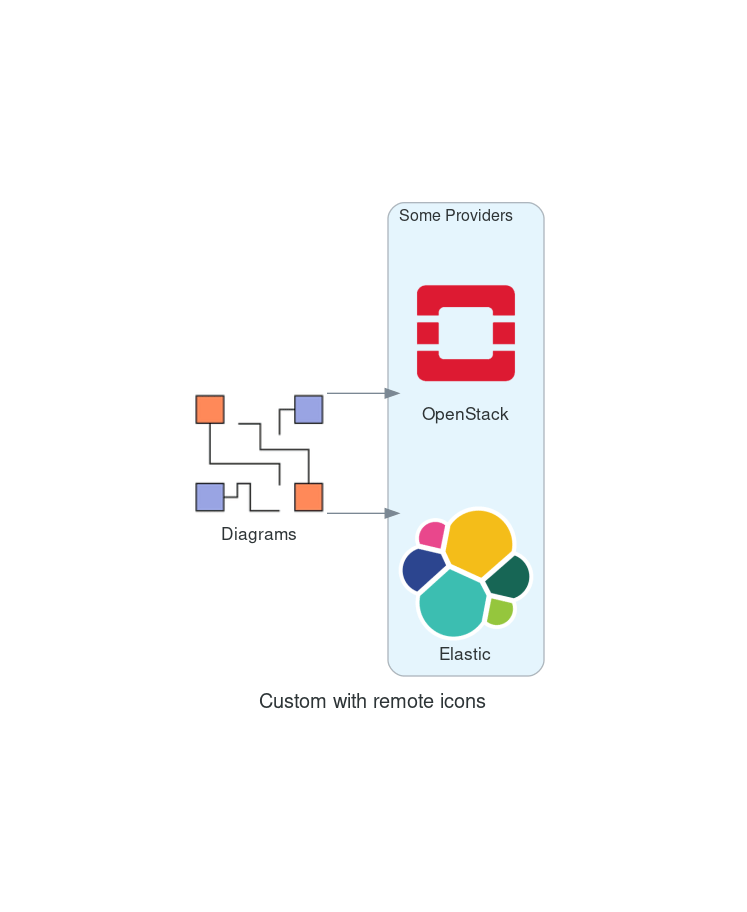
You can use custom icons for components not included in the standard providers:
```python theme={null}
from diagrams import Diagram, Cluster
from diagrams.custom import Custom
from urllib.request import urlretrieve
with Diagram("Custom with remote icons", show=False, direction="LR") as diag:
# Download icon image files
diagrams_url = "https://github.com/mingrammer/diagrams/raw/master/assets/img/diagrams.png"
diagrams_icon = "diagrams.png"
urlretrieve(diagrams_url, diagrams_icon)
diagrams = Custom("Diagrams", diagrams_icon)
with Cluster("Some Providers"):
openstack_url = "https://github.com/mingrammer/diagrams/raw/master/resources/openstack/openstack.png"
openstack_icon = "openstack.png"
urlretrieve(openstack_url, openstack_icon)
openstack = Custom("OpenStack", openstack_icon)
elastic_url = "https://github.com/mingrammer/diagrams/raw/master/resources/elastic/saas/elastic.png"
elastic_icon = "elastic.png"
urlretrieve(elastic_url, elastic_icon)
elastic = Custom("Elastic", elastic_icon)
diagrams >> openstack
diagrams >> elastic
```
### Custom Icons
You can use custom icons for components not included in the standard providers:
```python theme={null}
from diagrams import Diagram, Cluster
from diagrams.custom import Custom
from urllib.request import urlretrieve
with Diagram("Custom with remote icons", show=False, direction="LR") as diag:
# Download icon image files
diagrams_url = "https://github.com/mingrammer/diagrams/raw/master/assets/img/diagrams.png"
diagrams_icon = "diagrams.png"
urlretrieve(diagrams_url, diagrams_icon)
diagrams = Custom("Diagrams", diagrams_icon)
with Cluster("Some Providers"):
openstack_url = "https://github.com/mingrammer/diagrams/raw/master/resources/openstack/openstack.png"
openstack_icon = "openstack.png"
urlretrieve(openstack_url, openstack_icon)
openstack = Custom("OpenStack", openstack_icon)
elastic_url = "https://github.com/mingrammer/diagrams/raw/master/resources/elastic/saas/elastic.png"
elastic_icon = "elastic.png"
urlretrieve(elastic_url, elastic_icon)
elastic = Custom("Elastic", elastic_icon)
diagrams >> openstack
diagrams >> elastic
```
 ## Mermaid Diagrams
For simpler diagrams that don't require external dependencies, [Mermaid](https://mermaid.js.org/) provides a markdown-based syntax. Mermaid is supported natively in many documentation platforms including GitHub and Mintlify.
### Neural Network Architecture Example
Here's a Mermaid flowchart showing an upcycled MoE (Mixture of Experts) block:
```mermaid theme={null}
flowchart LR
subgraph OD["Original dense block"]
direction LR
OD_LN1["Layer norm"]
OD_ATT["Attention"]
OD_ADD1(["⊕"])
OD_LN2["Layer norm"]
OD_MLP["MLP"]
OD_ADD2(["⊕"])
OD_LN1 --> OD_ATT --> OD_ADD1 --> OD_LN2 --> OD_MLP --> OD_ADD2
OD_LN1 -. residual .-> OD_ADD1
OD_LN2 -. residual .-> OD_ADD2
end
subgraph UM["Upcycled MoE block"]
direction LR
U_LN1["Layer norm"]
U_ATT["Attention"]
U_ADD1(["⊕"])
U_LN2["Layer norm"]
subgraph UMOE["MoE"]
direction TB
ROUTER["Router from scratch"]
subgraph EXP["Experts"]
direction LR
EXP_MLP1["MLP 1"]
EXP_MLP2["MLP 2"]
EXP_MLPE["MLP E"]
end
WS["Weighted Sum"]
ROUTER --> EXP_MLP1
ROUTER --> EXP_MLP2
ROUTER --> EXP_MLPE
EXP_MLP1 --> WS
EXP_MLP2 --> WS
EXP_MLPE --> WS
end
U_ADD2(["⊕"])
U_LN1 --> U_ATT --> U_ADD1 --> U_LN2 --> ROUTER
WS --> U_ADD2
U_LN1 -. residual .-> U_ADD1
U_LN2 -. residual .-> U_ADD2
end
OD_LN1 -. "Copy weights" .-> U_LN1
OD_ATT -. "Copy weights" .-> U_ATT
OD_LN2 -. "Copy weights" .-> U_LN2
```
## Model Architecture Visualization
For visualizing trained model architectures (ONNX, TensorFlow, PyTorch, etc.), we recommend [Netron](https://github.com/lutzroeder/Netron) - a viewer for neural network, deep learning, and machine learning models.
Netron supports many formats including:
* ONNX (`.onnx`)
* TensorFlow Lite (`.tflite`)
* TensorFlow (`.pb`, `.meta`, SavedModel)
* Keras (`.h5`, `.keras`)
* PyTorch (`.pt`, `.pth`)
* Core ML (`.mlmodel`, `.mlpackage`)
You can use the [web version](https://netron.app/) or install it locally.
## When to Use Each Tool
| Tool | Best For |
| ------------------- | --------------------------------------------------------- |
| **Python diagrams** | Cloud architecture, infrastructure diagrams, C4 models |
| **Mermaid** | Quick flowcharts, sequence diagrams, embedded in markdown |
| **Netron** | Visualizing trained ML model architectures |
## Resources
* [Diagrams Documentation](https://diagrams.mingrammer.com/)
* [Mermaid Documentation](https://mermaid.js.org/)
* [Netron GitHub](https://github.com/lutzroeder/Netron)
* [C4 Model](https://c4model.com/)
***
[Edit this page on GitHub](https://github.com/aegean-ai/eaia/edit/main/src/blog/tutorials/creating-diagrams.mdx) or [file an issue](https://github.com/aegean-ai/eaia/issues/new/choose).
## Mermaid Diagrams
For simpler diagrams that don't require external dependencies, [Mermaid](https://mermaid.js.org/) provides a markdown-based syntax. Mermaid is supported natively in many documentation platforms including GitHub and Mintlify.
### Neural Network Architecture Example
Here's a Mermaid flowchart showing an upcycled MoE (Mixture of Experts) block:
```mermaid theme={null}
flowchart LR
subgraph OD["Original dense block"]
direction LR
OD_LN1["Layer norm"]
OD_ATT["Attention"]
OD_ADD1(["⊕"])
OD_LN2["Layer norm"]
OD_MLP["MLP"]
OD_ADD2(["⊕"])
OD_LN1 --> OD_ATT --> OD_ADD1 --> OD_LN2 --> OD_MLP --> OD_ADD2
OD_LN1 -. residual .-> OD_ADD1
OD_LN2 -. residual .-> OD_ADD2
end
subgraph UM["Upcycled MoE block"]
direction LR
U_LN1["Layer norm"]
U_ATT["Attention"]
U_ADD1(["⊕"])
U_LN2["Layer norm"]
subgraph UMOE["MoE"]
direction TB
ROUTER["Router from scratch"]
subgraph EXP["Experts"]
direction LR
EXP_MLP1["MLP 1"]
EXP_MLP2["MLP 2"]
EXP_MLPE["MLP E"]
end
WS["Weighted Sum"]
ROUTER --> EXP_MLP1
ROUTER --> EXP_MLP2
ROUTER --> EXP_MLPE
EXP_MLP1 --> WS
EXP_MLP2 --> WS
EXP_MLPE --> WS
end
U_ADD2(["⊕"])
U_LN1 --> U_ATT --> U_ADD1 --> U_LN2 --> ROUTER
WS --> U_ADD2
U_LN1 -. residual .-> U_ADD1
U_LN2 -. residual .-> U_ADD2
end
OD_LN1 -. "Copy weights" .-> U_LN1
OD_ATT -. "Copy weights" .-> U_ATT
OD_LN2 -. "Copy weights" .-> U_LN2
```
## Model Architecture Visualization
For visualizing trained model architectures (ONNX, TensorFlow, PyTorch, etc.), we recommend [Netron](https://github.com/lutzroeder/Netron) - a viewer for neural network, deep learning, and machine learning models.
Netron supports many formats including:
* ONNX (`.onnx`)
* TensorFlow Lite (`.tflite`)
* TensorFlow (`.pb`, `.meta`, SavedModel)
* Keras (`.h5`, `.keras`)
* PyTorch (`.pt`, `.pth`)
* Core ML (`.mlmodel`, `.mlpackage`)
You can use the [web version](https://netron.app/) or install it locally.
## When to Use Each Tool
| Tool | Best For |
| ------------------- | --------------------------------------------------------- |
| **Python diagrams** | Cloud architecture, infrastructure diagrams, C4 models |
| **Mermaid** | Quick flowcharts, sequence diagrams, embedded in markdown |
| **Netron** | Visualizing trained ML model architectures |
## Resources
* [Diagrams Documentation](https://diagrams.mingrammer.com/)
* [Mermaid Documentation](https://mermaid.js.org/)
* [Netron GitHub](https://github.com/lutzroeder/Netron)
* [C4 Model](https://c4model.com/)
***
[Edit this page on GitHub](https://github.com/aegean-ai/eaia/edit/main/src/blog/tutorials/creating-diagrams.mdx) or [file an issue](https://github.com/aegean-ai/eaia/issues/new/choose).