> ## Documentation Index
> Fetch the complete documentation index at: https://aegean.ai/llms.txt
> Use this file to discover all available pages before exploring further.
# Data Analysis
> Data collection and analysis of seam quality images
## Data Collection
Our data collection was performed at the production facility. We used the collected data to populate the metadata of the created dataset.
## Semantic Zones and Interpretable Features
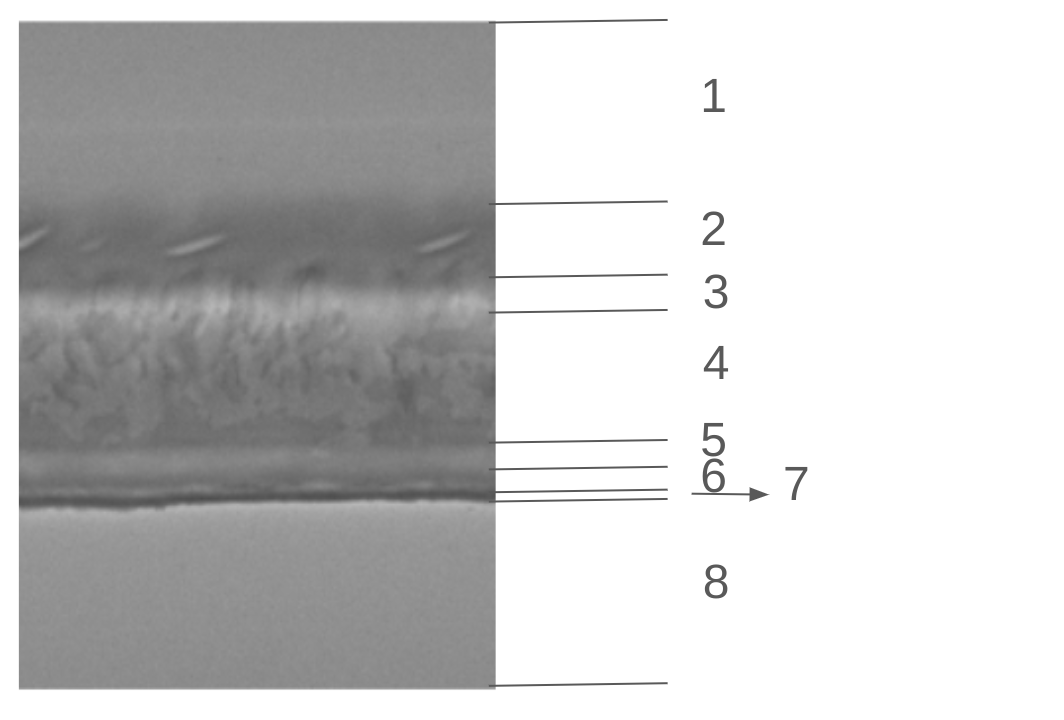
The sideseam can be characterized by 8 zones. Each zone except from zones 1 and 8 where we see no significant variability across machine settings, behaves differently depending on the machine setting.
 ### Zone Variability by Machine Setting
| Machine Setting | Zone 2 | Zone 3 | Zone 4-Zone 5 | Zone 6 | Zone 7 |
| --------------- | ---------------------------------- | -------------------------- | ------------- | -------------------------- | ---------------------------------- |
| A | scattered to continuous engravings | grooves | medium grey | grooves | waving and dark gray line |
| A1 | deformed continuous engravings | shallow grooves | medium grey | shallow groove | waving and dark gray line |
| A2 | deformed continuous engravings | shallow grooves with bumps | medium grey | shallow grooves with bumps | waving and dark gray line |
| B | scattered engravings | shallow grooves | darker grey | shallow grooves | slightly waving and dark gray line |
| C | smooth with no engravings | grooves | medium grey | grooves | straight and dark gray line |
| D | deformed engravings | grooves | medium grey | grooves | straight and dark gray line |
| E | highly deformed engravings | grooves | darker grey | grooves | straight and dark gray line |
| F | scattered engravings | shallow grooves | medium grey | grooves | straight and dark gray line |
The question that we can now pose is whether the machine setting images can be used to distinguish between the nominal and anomalous condition. We need to map some of the impact seen by changing the machine setting to an anomalous condition and this can be done in two ways:
1. By detecting a feature that we *believe* leads to a stress test failure of the product.
2. By actually performing a stress test and mapping the results to the machine settings.
For the first case, we highlight two features:
### Zone Variability by Machine Setting
| Machine Setting | Zone 2 | Zone 3 | Zone 4-Zone 5 | Zone 6 | Zone 7 |
| --------------- | ---------------------------------- | -------------------------- | ------------- | -------------------------- | ---------------------------------- |
| A | scattered to continuous engravings | grooves | medium grey | grooves | waving and dark gray line |
| A1 | deformed continuous engravings | shallow grooves | medium grey | shallow groove | waving and dark gray line |
| A2 | deformed continuous engravings | shallow grooves with bumps | medium grey | shallow grooves with bumps | waving and dark gray line |
| B | scattered engravings | shallow grooves | darker grey | shallow grooves | slightly waving and dark gray line |
| C | smooth with no engravings | grooves | medium grey | grooves | straight and dark gray line |
| D | deformed engravings | grooves | medium grey | grooves | straight and dark gray line |
| E | highly deformed engravings | grooves | darker grey | grooves | straight and dark gray line |
| F | scattered engravings | shallow grooves | medium grey | grooves | straight and dark gray line |
The question that we can now pose is whether the machine setting images can be used to distinguish between the nominal and anomalous condition. We need to map some of the impact seen by changing the machine setting to an anomalous condition and this can be done in two ways:
1. By detecting a feature that we *believe* leads to a stress test failure of the product.
2. By actually performing a stress test and mapping the results to the machine settings.
For the first case, we highlight two features:
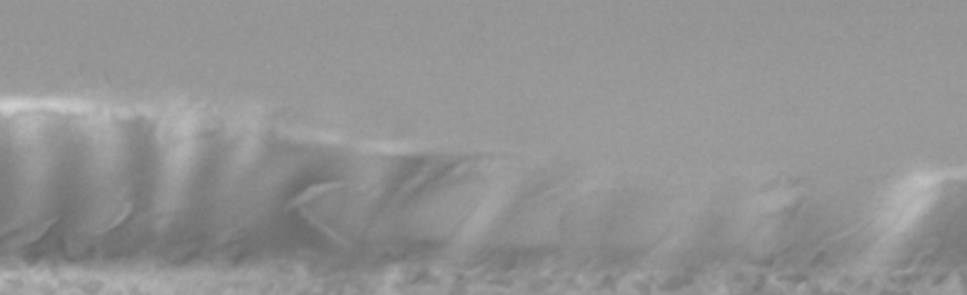
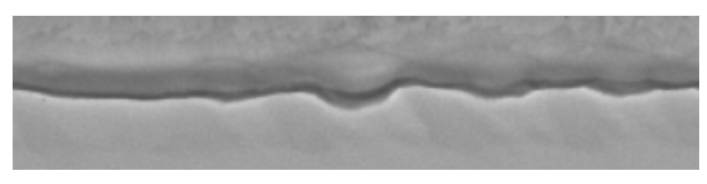 For the second case, after examining the stress test results, **for the purposes of this report, the image class `C` is mapped to the `FAIL` anomaly class (anomalous condition).**
## Observations
Images from the 12 machine settings appear similar to each other. The similarity between the images is due to two factors:
1. Different machine settings belong to the same machine setting category and within the category they affect similarly the images.
2. The images are blurred due to an incorrect focus of the camera during data collection. A de-blurring algorithm may result in images with much better discrimination.
The image similarity poses a problem for *any* computer vision model to distinguish between the nominal and anomalous images and therefore perform with the required accuracy.
The machine setting categorization allows us to merge the 12 machine settings to 4 categories:
| Image Classes | Machine Configuration Category Name | Semantics |
| --------------- | ----------------------------------- | -------------------------- |
| A, B, C, A1, A2 | δT | Difference in Temperature |
| D, E, F | δP | Difference in Pressure |
| H, I | δL | Difference in Line rate |
| J, K | δO | Difference in seam Overlap |
## Plant Variability
On top of the variability across machine settings, the zones also exhibit variability across plants.
For the second case, after examining the stress test results, **for the purposes of this report, the image class `C` is mapped to the `FAIL` anomaly class (anomalous condition).**
## Observations
Images from the 12 machine settings appear similar to each other. The similarity between the images is due to two factors:
1. Different machine settings belong to the same machine setting category and within the category they affect similarly the images.
2. The images are blurred due to an incorrect focus of the camera during data collection. A de-blurring algorithm may result in images with much better discrimination.
The image similarity poses a problem for *any* computer vision model to distinguish between the nominal and anomalous images and therefore perform with the required accuracy.
The machine setting categorization allows us to merge the 12 machine settings to 4 categories:
| Image Classes | Machine Configuration Category Name | Semantics |
| --------------- | ----------------------------------- | -------------------------- |
| A, B, C, A1, A2 | δT | Difference in Temperature |
| D, E, F | δP | Difference in Pressure |
| H, I | δL | Difference in Line rate |
| J, K | δO | Difference in seam Overlap |
## Plant Variability
On top of the variability across machine settings, the zones also exhibit variability across plants.
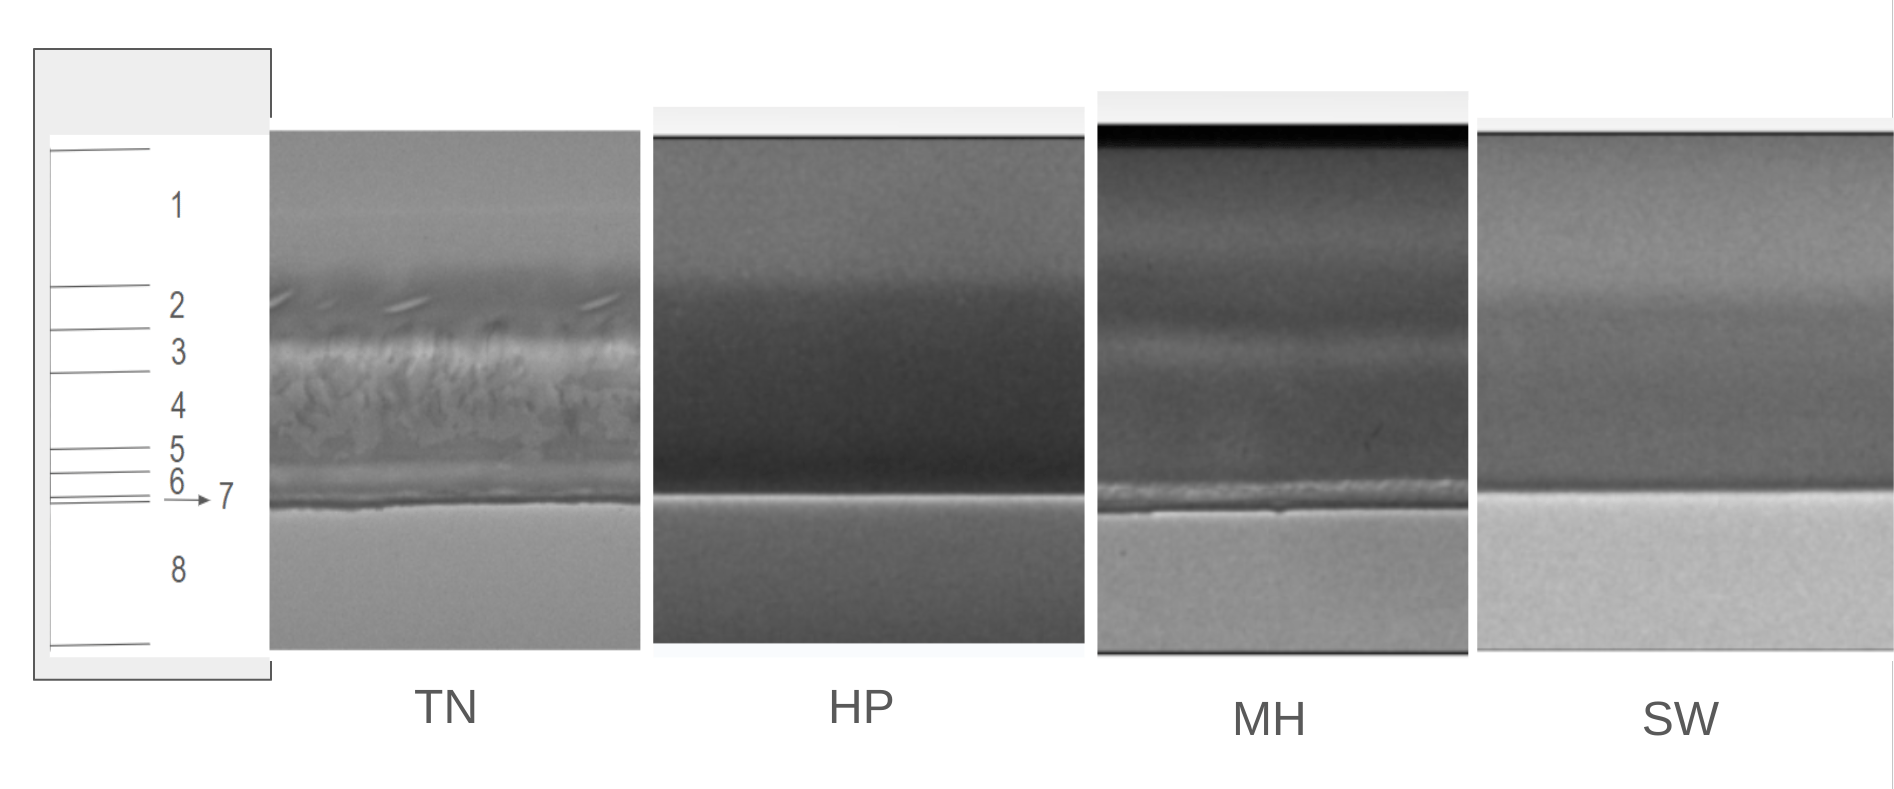 The model must be able to perform well across plants and therefore the model must be exposed to images from *all* plants and *domain adaptation* may be required.
***
[Edit this page on GitHub](https://github.com/aegean-ai/eaia/edit/main/src/products/applications/anomaly-detection/manufacturing/data-pipeline/index.mdx) or [file an issue](https://github.com/aegean-ai/eaia/issues/new/choose).
The model must be able to perform well across plants and therefore the model must be exposed to images from *all* plants and *domain adaptation* may be required.
***
[Edit this page on GitHub](https://github.com/aegean-ai/eaia/edit/main/src/products/applications/anomaly-detection/manufacturing/data-pipeline/index.mdx) or [file an issue](https://github.com/aegean-ai/eaia/issues/new/choose).