> ## Documentation Index
> Fetch the complete documentation index at: https://aegean.ai/llms.txt
> Use this file to discover all available pages before exploring further.
# Pretrained CNN
> Using pretrained ResNet-50 for feature extraction in anomaly detection
## Introduction
In the histogram analysis we used histograms to quantify the pixel-level information of the Seamagine dataset images and we saw that the performance of AD on pixel level metrics is dismal. The answer to this problem is to use a feature extraction method that can provide a hierarchical aggregation of the features of the image and project them into a lower-dimensional space - the manifold.
Here we use a pretrained Convolutional Neural Network (CNN) to provide such features in the form of a 2048-dim vector that we then feed into a UMAP algorithm.
The aim here is to extract representations mapped into an embedded space in such a way that nominal images that are similar to each other have a smaller distance between them than images that are dissimilar. In other words, some form of *clustering* in the embedded space is observed where we should expect the vast majority of nominal images to cluster closer together while the anomalous ones to form a cluster that is topologically separated from the nominal cluster or has a small overlap with it.
## ResNet-50
The ResNet-50 model is a deep convolutional neural network. It was pretrained in a discriminative way on a large dataset of natural images known as ImageNet that has $K=1000$ classes.
For each $224 \times 224$ dataset image in our training dataset we obtain a 2048-dim vector at the global pooling layer.
## Visualizing the test and train datasets with UMAP
We tried three dimension-reducing algorithms: PCA, UMAP and t-SNE and based on the results we selected the UMAP algorithm for this task. UMAP forms clusters that construct a weighted k-nearest neighbors graph to model the high-dimensional data structure and then optimizes a low-dimensional representation of this graph to preserve topological features of the original data.
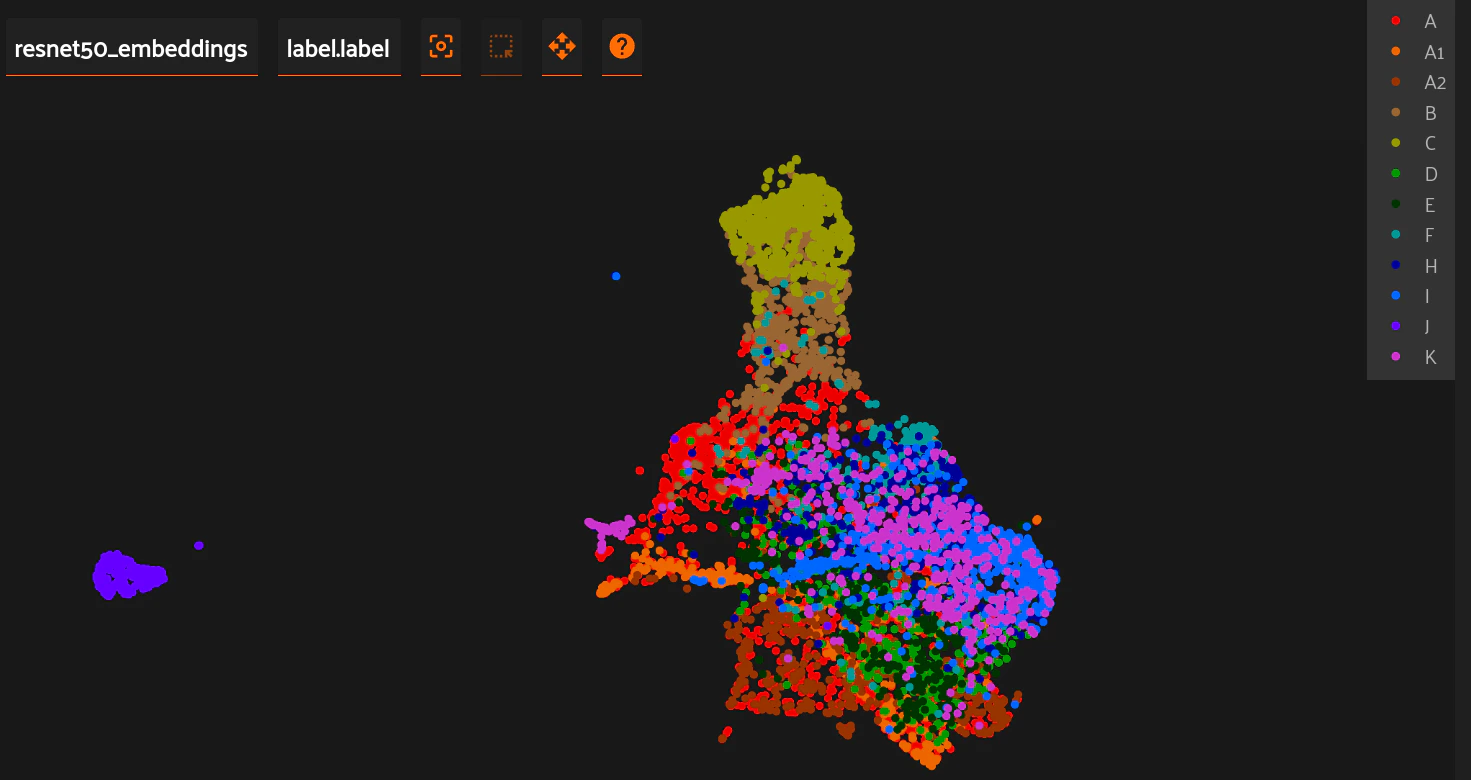 The visualization above is indicative of the clustering but clustering needs to be quantified in a dimensional space that is greater than $d=2$ or $d=3$ that is used for visualization purposes.
***
[Edit this page on GitHub](https://github.com/aegean-ai/eaia/edit/main/src/products/applications/anomaly-detection/manufacturing/unsupervised-learning-models/pretrained/cnn/index.mdx) or [file an issue](https://github.com/aegean-ai/eaia/issues/new/choose).
The visualization above is indicative of the clustering but clustering needs to be quantified in a dimensional space that is greater than $d=2$ or $d=3$ that is used for visualization purposes.
***
[Edit this page on GitHub](https://github.com/aegean-ai/eaia/edit/main/src/products/applications/anomaly-detection/manufacturing/unsupervised-learning-models/pretrained/cnn/index.mdx) or [file an issue](https://github.com/aegean-ai/eaia/issues/new/choose).