> ## Documentation Index
> Fetch the complete documentation index at: https://aegean.ai/llms.txt
> Use this file to discover all available pages before exploring further.
# NJ Inference Run Results
> A New Jersey State-Wide Centerline Extraction Run.
 ## Introduction
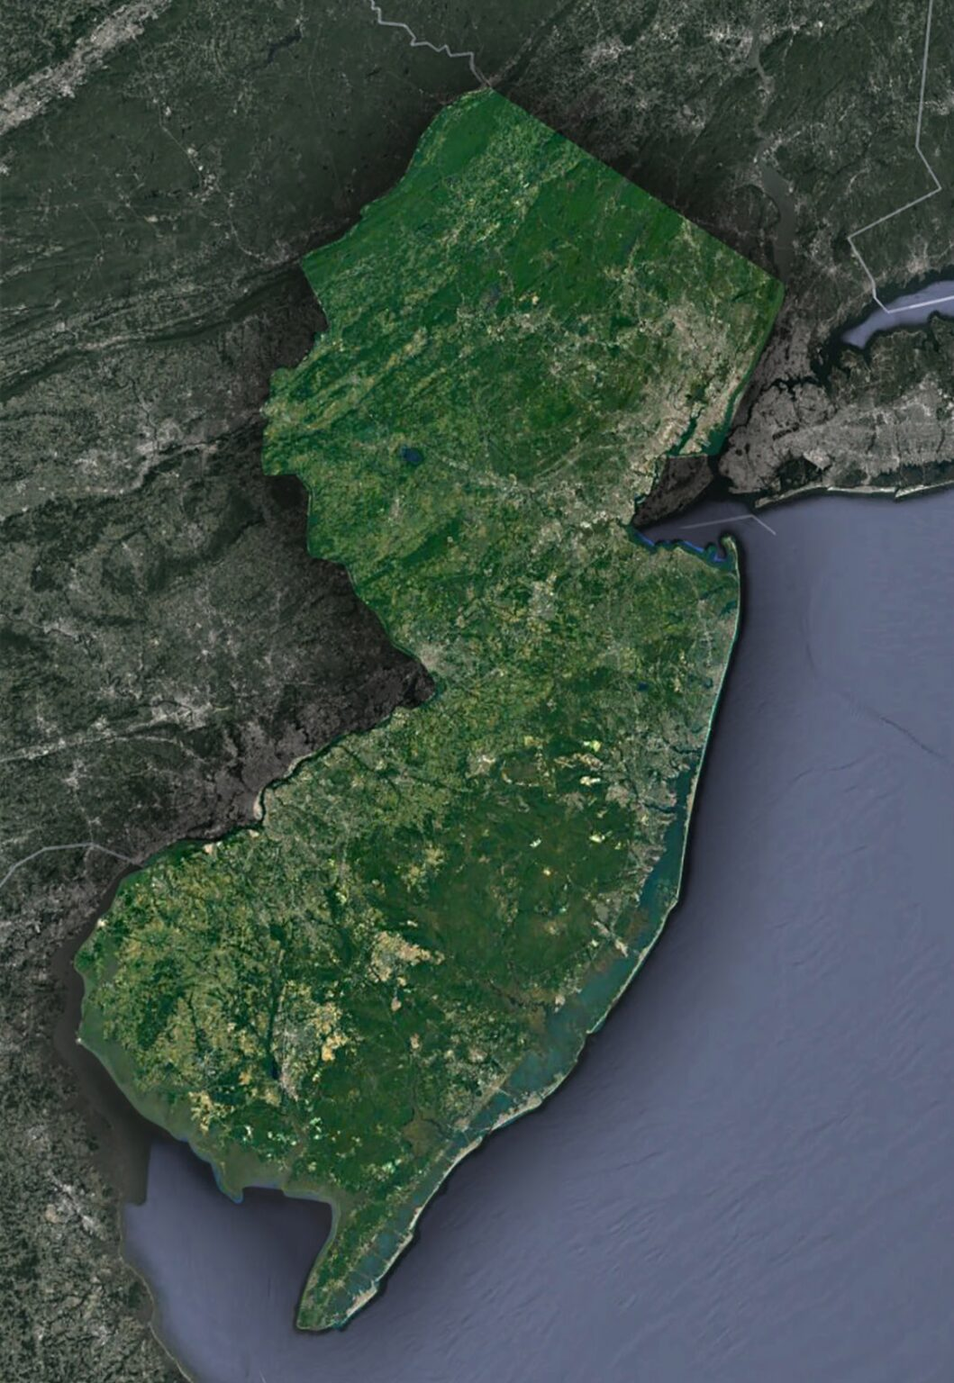
This chapter presents the results of a **statewide inference run for extracting sidewalk centerlines across New Jersey**. The input data consists of statewide high-resolution aerial imagery available as GeoTIFF tiles, which were preprocessed into model-ready chips through a tiling and normalization pipeline.
The run was conducted as the **first large-scale test deployment** of our geospatial ML pipeline. The primary objectives were:
* **Output Fidelity**: Generate statewide sidewalk detections and assess their quality
* **Scalability Check**: Validate that our Ray + Triton inference pipeline can handle thousands of tiles
* **Performance Baseline**: Measure throughput, bottlenecks, and failure points
## Hardware Setup
* Single GPU (GPU 0)
* NVIDIA A4000 GPU
## Data & Preprocessing
The input consisted of statewide **high-resolution aerial imagery of New Jersey**, provided as GeoTIFF tiles.
### Preprocessing Pipeline
* **Pseudo-color Conversion:** To match the model's training format (NIR-G-B)
* **Normalization:** Tile pixel values normalized from UINT16 to UINT8
* **Dynamic Padding:** Tile pixel dimensions padded to support overlap between chips
* **Chipping:** Large GeoTIFFs divided into fixed-size chips (256×256)
## Pipeline Stages
1. **Loader**, Reading tiles from storage, applying padding, generating chips
2. **Inference**, Queueing, batching, model execution, mask thresholding, reconstruction
3. **Postprocess**, Polygonization, filtering, and centerline extraction
## Results
### Tile and Job Statistics
| Metric | Value |
| -------------------------------- | -------------------- |
| Total tiles processed | 9,202 |
| Input tile dimensions | 5,000 × 5,000 pixels |
| Chip size | 256 × 256 pixels |
| Chips per tile (avg) | 529 |
| Total chips processed | 4,867,858 |
| Total pixels processed | \~319 billion |
| Estimated statewide coverage | \~21,350 km² |
| Total job wall time | \~17.2 hours |
| Tiles per minute | 8.88 |
| Average tile throughput per hour | 535 |
### Overall Run Performance
| Metric | Value |
| --------------------------- | -------- |
| Success rate | 99.66% |
| Failed tiles | 31/9,202 |
| Total centerlines extracted | 889,568 |
| Avg centerlines per tile | 96.73 |
### Stage Timings (seconds)
| Stage | avg | p50 | p90 | p99 |
| ----------- | ----- | ----- | ----- | ----- |
| Loader | 6.46 | 6.37 | 7.02 | 8.30 |
| Inference | 54.46 | 54.04 | 60.86 | 66.06 |
| Postprocess | 5.19 | 3.60 | 10.46 | 22.13 |
| End-to-end | 66.11 | 64.99 | 75.29 | 88.70 |
### Stage Share of End-to-End Time
**Median (p50):**
* Loader: \~9.8%
* Inference: \~83.2%
* Postprocess: \~5.5%
### Centerline Quality
Compared with OpenStreetMap (OSM) sidewalk centerline annotations:
**Strengths:**
* Alignment with visible sidewalks
* High-value annotations where predictions are strong
* Conservative modeling choice (erring on underprediction)
**Limitations:**
* Underprediction & occlusion gaps
* Some false positives in highways, driveways, parking lots
* Continuity issues in fragmented segments
### Key Takeaways
* **Scalability validated:** 9,202 statewide tiles processed in 17.2 hours
* **High reliability:** 99.66% success rate
* **Inference-bound performance:** \~80–83% of per-tile time
* **Annotation quality:** Predictions aligned well with visible sidewalks
## Potential Optimizations
1. **Pipeline Throughput**, Target 30-50% improvement to achieve \~9-12 hour overnight runs
2. **Larger / Better Training Dataset**, Including DVRPC and Boston imagery
3. **Centerline Extraction**, Dynamic parameterization and occlusion handling
4. **Dynamic Tile Treatment**, Lightweight classifier for routing tiles to specialized processing
## Chapter Summary
This statewide case study demonstrates both the **scalability of our pipeline** and the **quality trade-offs of automated sidewalk extraction**. The pipeline successfully processed over **9,200 tiles and nearly 5 million chips**, validating statewide scale operation.
Performance analysis shows that **inference is the dominant bottleneck**, consuming \~80% of per-tile runtime. The results provide a **robust baseline** for benchmarking future improvements in throughput and efficiency.
***
[Edit this page on GitHub](https://github.com/aegean-ai/eaia/edit/main/src/products/applications/remote-sensing/inference/pipeline_results/index.mdx) or [file an issue](https://github.com/aegean-ai/eaia/issues/new/choose).
## Introduction
This chapter presents the results of a **statewide inference run for extracting sidewalk centerlines across New Jersey**. The input data consists of statewide high-resolution aerial imagery available as GeoTIFF tiles, which were preprocessed into model-ready chips through a tiling and normalization pipeline.
The run was conducted as the **first large-scale test deployment** of our geospatial ML pipeline. The primary objectives were:
* **Output Fidelity**: Generate statewide sidewalk detections and assess their quality
* **Scalability Check**: Validate that our Ray + Triton inference pipeline can handle thousands of tiles
* **Performance Baseline**: Measure throughput, bottlenecks, and failure points
## Hardware Setup
* Single GPU (GPU 0)
* NVIDIA A4000 GPU
## Data & Preprocessing
The input consisted of statewide **high-resolution aerial imagery of New Jersey**, provided as GeoTIFF tiles.
### Preprocessing Pipeline
* **Pseudo-color Conversion:** To match the model's training format (NIR-G-B)
* **Normalization:** Tile pixel values normalized from UINT16 to UINT8
* **Dynamic Padding:** Tile pixel dimensions padded to support overlap between chips
* **Chipping:** Large GeoTIFFs divided into fixed-size chips (256×256)
## Pipeline Stages
1. **Loader**, Reading tiles from storage, applying padding, generating chips
2. **Inference**, Queueing, batching, model execution, mask thresholding, reconstruction
3. **Postprocess**, Polygonization, filtering, and centerline extraction
## Results
### Tile and Job Statistics
| Metric | Value |
| -------------------------------- | -------------------- |
| Total tiles processed | 9,202 |
| Input tile dimensions | 5,000 × 5,000 pixels |
| Chip size | 256 × 256 pixels |
| Chips per tile (avg) | 529 |
| Total chips processed | 4,867,858 |
| Total pixels processed | \~319 billion |
| Estimated statewide coverage | \~21,350 km² |
| Total job wall time | \~17.2 hours |
| Tiles per minute | 8.88 |
| Average tile throughput per hour | 535 |
### Overall Run Performance
| Metric | Value |
| --------------------------- | -------- |
| Success rate | 99.66% |
| Failed tiles | 31/9,202 |
| Total centerlines extracted | 889,568 |
| Avg centerlines per tile | 96.73 |
### Stage Timings (seconds)
| Stage | avg | p50 | p90 | p99 |
| ----------- | ----- | ----- | ----- | ----- |
| Loader | 6.46 | 6.37 | 7.02 | 8.30 |
| Inference | 54.46 | 54.04 | 60.86 | 66.06 |
| Postprocess | 5.19 | 3.60 | 10.46 | 22.13 |
| End-to-end | 66.11 | 64.99 | 75.29 | 88.70 |
### Stage Share of End-to-End Time
**Median (p50):**
* Loader: \~9.8%
* Inference: \~83.2%
* Postprocess: \~5.5%
### Centerline Quality
Compared with OpenStreetMap (OSM) sidewalk centerline annotations:
**Strengths:**
* Alignment with visible sidewalks
* High-value annotations where predictions are strong
* Conservative modeling choice (erring on underprediction)
**Limitations:**
* Underprediction & occlusion gaps
* Some false positives in highways, driveways, parking lots
* Continuity issues in fragmented segments
### Key Takeaways
* **Scalability validated:** 9,202 statewide tiles processed in 17.2 hours
* **High reliability:** 99.66% success rate
* **Inference-bound performance:** \~80–83% of per-tile time
* **Annotation quality:** Predictions aligned well with visible sidewalks
## Potential Optimizations
1. **Pipeline Throughput**, Target 30-50% improvement to achieve \~9-12 hour overnight runs
2. **Larger / Better Training Dataset**, Including DVRPC and Boston imagery
3. **Centerline Extraction**, Dynamic parameterization and occlusion handling
4. **Dynamic Tile Treatment**, Lightweight classifier for routing tiles to specialized processing
## Chapter Summary
This statewide case study demonstrates both the **scalability of our pipeline** and the **quality trade-offs of automated sidewalk extraction**. The pipeline successfully processed over **9,200 tiles and nearly 5 million chips**, validating statewide scale operation.
Performance analysis shows that **inference is the dominant bottleneck**, consuming \~80% of per-tile runtime. The results provide a **robust baseline** for benchmarking future improvements in throughput and efficiency.
***
[Edit this page on GitHub](https://github.com/aegean-ai/eaia/edit/main/src/products/applications/remote-sensing/inference/pipeline_results/index.mdx) or [file an issue](https://github.com/aegean-ai/eaia/issues/new/choose).