

 A transformer takes a sequence of tokens. The transformer pages of the NLP chapter built one for text, where a tokenizer turns a sentence into a sequence of word pieces and an embedding table turns each piece into a vector. The vision transformer (ViT) of Dosovitskiy et al. applies the same encoder to images with one change at the input: the image is cut into square patches, and each patch becomes a token (Dosovitskiy et al., 2020). Everything after that step is the transformer you already know.
This section builds a small ViT in PyTorch, piece by piece, and trains it on CIFAR-10. Along the way it answers the questions that the one-line summary hides. How does a patch become a vector? How does the model know where a patch was in the image, and what happens when the image size changes? Which token does the classifier read? Why did ViT need hundreds of millions of training images to beat a convolutional network, and what made it work on a data set of ordinary size?
You need the attention mechanism from single-head and multi-head self-attention. The ViT encoder is the text encoder of the NLP chapter with the causal mask removed; cross-attention and position encoding explains the difference between an encoder and a decoder.
Images as sequences of patches
A color image cut into patches of pixels gives an grid of patches, in total. Each patch holds numbers. Flatten each patch into a vector and multiply it by a learned matrix to get a token of dimension : The same is applied to every patch, just as the same embedding table is used for every word.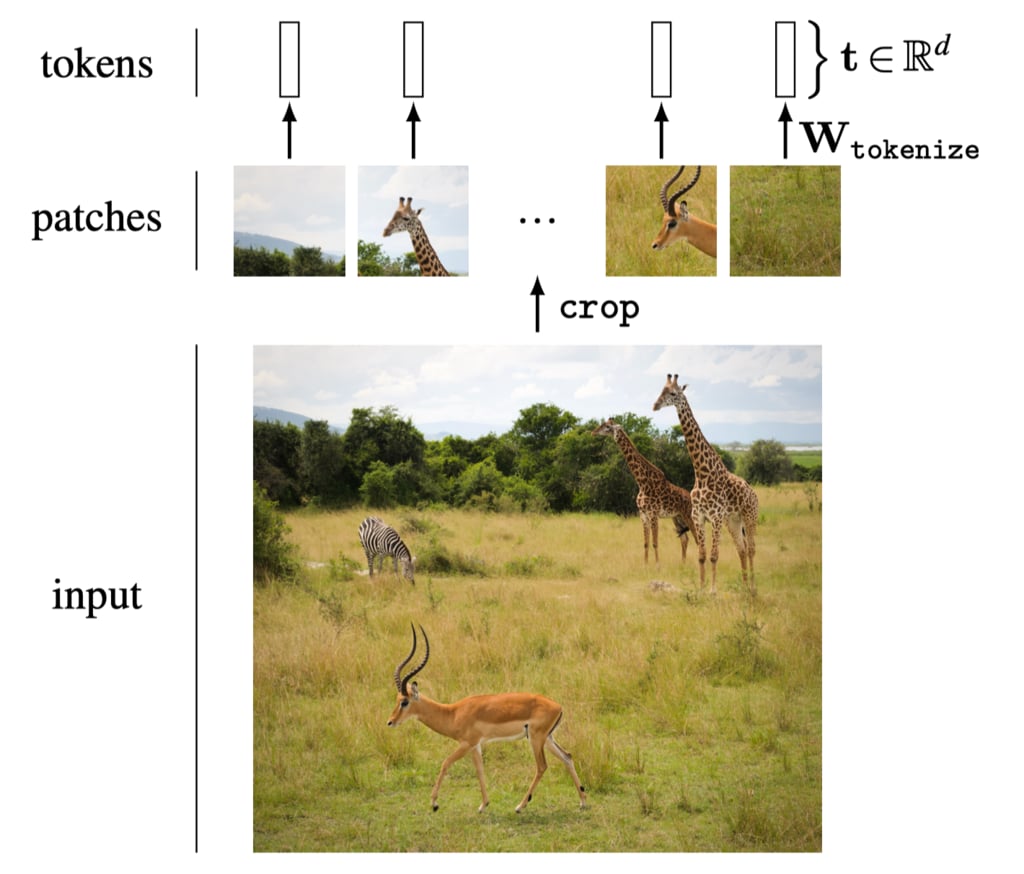
nn.Conv2d. The cell below checks that the two give the same tokens when the convolution kernel is the matrix reshaped.
The [CLS] token and position embeddings
Two things are still missing before the tokens can enter the encoder. The first is a place to read the answer from. ViT follows BERT and adds one extra learned vector, the class token [CLS], at the start of the sequence. It corresponds to no patch. Through attention it collects information from all the patch tokens, and after the last layer a linear classifier reads only the [CLS] output. The alternative is to average the outputs of all patch tokens (mean pooling) and classify the average. Both work, and the experiments below compare them. The second is position. Self-attention is permutation equivariant: shuffle the input tokens and the outputs are shuffled the same way, with no other change. Without extra information the encoder could not tell a patch in the top-left corner from the same patch in the bottom-right. ViT adds a learned vector to each token, one per position: The positions are numbered along the rows of the grid, so the model is not told that position 9 is directly below position 1. It has to learn the 2D layout from data. Dosovitskiy et al. tried position embeddings that encode the row and column explicitly and found no clear gain over this 1D version. After training, the learned embeddings of neighboring patches are similar, which the plot near the end of this section shows.The encoder block
Each encoder block is the one from the NLP chapter: layer normalization, multi-head self-attention and a residual connection, then layer normalization, a two-layer MLP applied to each token separately and a second residual connection. ViT puts the normalization before each sublayer (pre-norm), which trains more stably than the post-norm layout of the original transformer.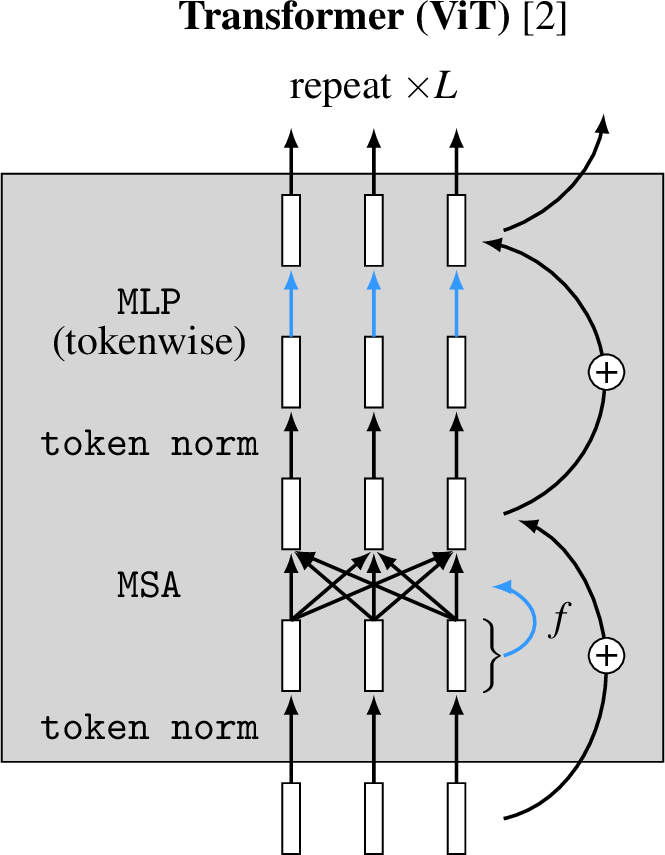
nn.MultiheadAttention expects its input as (sequence, batch, features) unless it is created with batch_first=True. The tokens here are (batch, sequence, features). Without the flag, the layer reads the batch axis as the sequence axis, and each token attends to the tokens at the same position in the other images of the batch instead of the other patches of its own image. The model still runs and still trains, but it cannot learn anything useful, and its accuracy stays at chance. An earlier version of this section had exactly this bug.
The full model
The model chains the pieces: patch embedding, [CLS] token, position embeddings, encoder blocks, a final layer norm and a linear head. Thepool argument chooses whether the head reads the [CLS] output or the mean of the patch outputs.
The configuration is a small one for images: patches of pixels (64 tokens plus [CLS]), , 3 heads and 6 blocks, about 2.7 million parameters. ViT-Base, the model of the paper, uses patches on images (196 tokens), , 12 heads and 12 blocks, 86 million parameters. On a image a patch would leave only four tokens, which is why the patch size shrinks with the image.
Inductive bias and data
A convolutional network builds two assumptions about images into its architecture. A convolution looks at a small neighborhood, so the network starts from local features (locality). The same kernel slides over the whole image, so a pattern is detected the same way wherever it appears (translation equivariance). These assumptions are the network’s inductive bias. They are right for most images, and they let a CNN learn from a modest data set. A ViT has almost none of this. Only the patch embedding is local, and every attention layer can connect any patch to any other from the first block on. Which patches matter for which, and the fact that nearby patches tend to belong together, must be learned from the data. Dosovitskiy et al. found that ViT trained on ImageNet-1k (1.3 million images) was a few points less accurate than a ResNet of similar size. Pretrained on ImageNet-21k (14 million) the two were close, and pretrained on JFT-300M (300 million) ViT was more accurate. With enough data, learning the structure works better than assuming it. Touvron et al. then showed that a ViT can reach ResNet accuracy when trained on ImageNet-1k alone, if the training adds strong data augmentation and regularization (DeiT, arXiv:2012.12877). Augmentation makes up for missing data: each random crop or flip is a new image with the same label, and it teaches the model that the label does not depend on the exact position of the object, which is the assumption that a CNN gets from its architecture. CIFAR-10 has 50,000 training images, far fewer than ImageNet, so the effect should be visible here. The experiment below trains the same ViT three times: without augmentation, with random crops and horizontal flips, and with augmentation and mean pooling instead of [CLS].Training on CIFAR-10
The 50,000 training images are split into 45,000 for training and 5,000 for validation. The test set is used once, at the end. Each run trains for 30 epochs with AdamW, a learning rate that rises for two epochs and then decays along a cosine, and bfloat16 arithmetic on the GPU.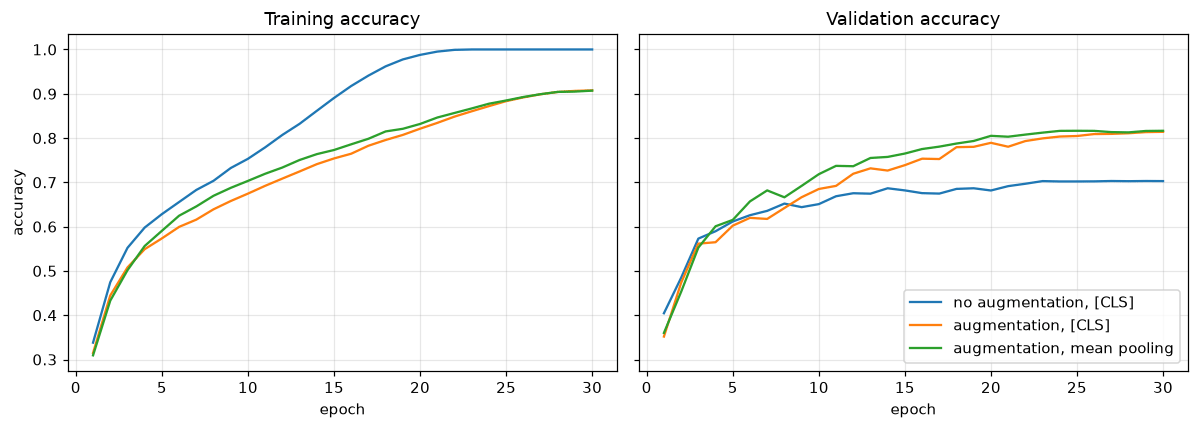
What the position embeddings learned
Each position embedding is a vector of 192 numbers, and nothing in their initialization says that position 1 is next to position 2 or position 9. The plot shows, for each of the 64 patch positions, the cosine similarity of its embedding with the embeddings of all 64 positions, laid out on the grid. Each small square belongs to one position, and it is brightest at that position itself.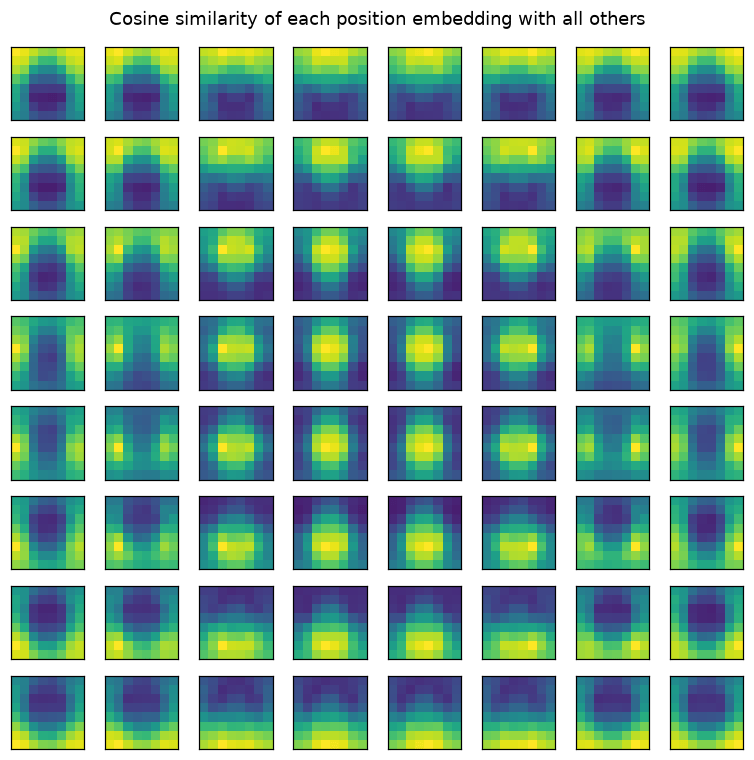
Changing the image resolution
The position embeddings tie the model to one grid size. A image cut into patches gives a grid, 144 tokens, and the model has embeddings for only 64. The standard fix, used when a ViT pretrained at one resolution is fine-tuned at a higher one, is to treat the 64 patch embeddings as an image with 192 channels and resize it to with bicubic interpolation. The [CLS] embedding is kept as it is. The cell evaluates the best model on validation images upsampled to , once with interpolated position embeddings and, for comparison, at the original .Attention maps
The attention weights of the [CLS] token in the last block show which patches the classifier’s input was built from. For each image below, the weights of the [CLS] query over the 64 patches, averaged over the heads, are reshaped to the grid and drawn over the image. These maps come from a single layer of a small model, so they are a rough picture. Methods such as attention rollout combine the maps of all layers.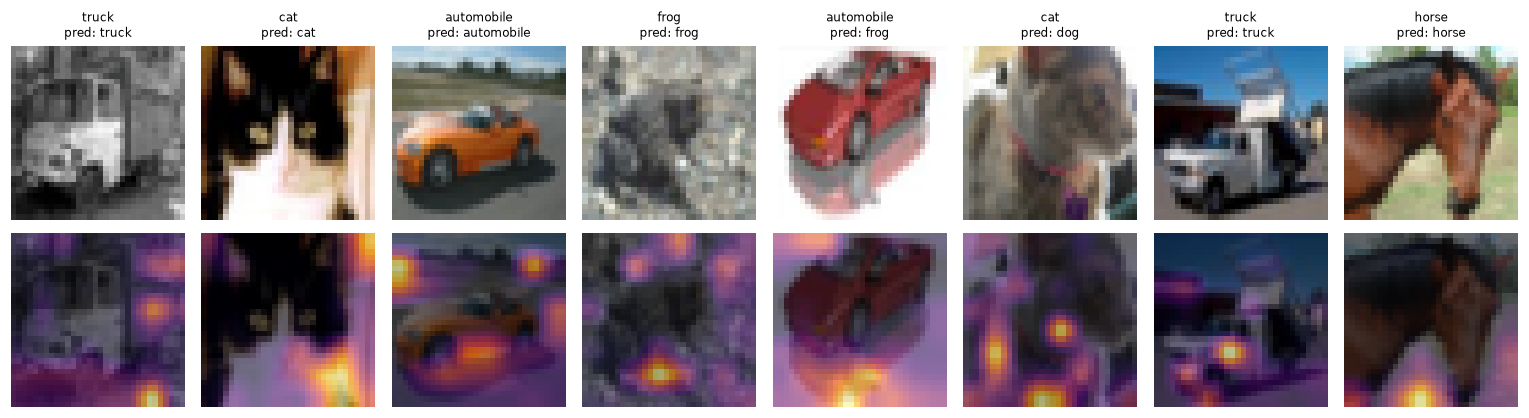
Exercises
- Train the model for 30 epochs with patches of pixels (16 tokens) and pixels (256 tokens). Report the validation accuracy and the training time per epoch, and explain both with the cost of attention, which grows with the square of the number of tokens.
- Remove the position embeddings (set them to zero and freeze them). How much accuracy does the model lose? Then shuffle the patch order of every validation image with one fixed permutation and evaluate the model with and without position embeddings. Explain the result with permutation equivariance.
- Replace the 1D position embeddings with 2D ones: one learned vector per row and one per column, each of dimension , concatenated. Compare the accuracy and the similarity plot with the 1D version.
- Add a stronger augmentation, such as
transforms.RandAugment(), and train for 60 epochs. Does the gap to the run without augmentation keep growing with longer training? - Train a small CNN with about the same number of parameters on the same split and with the same augmentation. Which is more accurate after 30 epochs, and how does the answer relate to inductive bias?
Key references
Dosovitskiy et al. introduced the vision transformer and measured how its accuracy depends on the size of the pretraining data (Dosovitskiy et al., 2020). Chapter 26 of Torralba, Isola and Freeman explains tokens and attention for images (Foundations of Computer Vision, n.d.).PyTorch reference
References
- Dosovitskiy, A., Beyer, L., Kolesnikov, A., Weissenborn, D., Zhai, X., et al. (2020). An Image is Worth 16x16 Words: Transformers for Image Recognition at Scale. arXiv [cs.CV].
- (n.d.). Foundations of Computer Vision.
Found an error on this page? Report an issue.