

Python Diagrams Package
The diagrams Python package allows you to draw cloud system architecture diagrams using Python code. It supports major cloud providers (AWS, Azure, GCP), on-premise infrastructure, and custom icons.Installation
AWS Architecture Example
Here’s how to create a clustered web services diagram: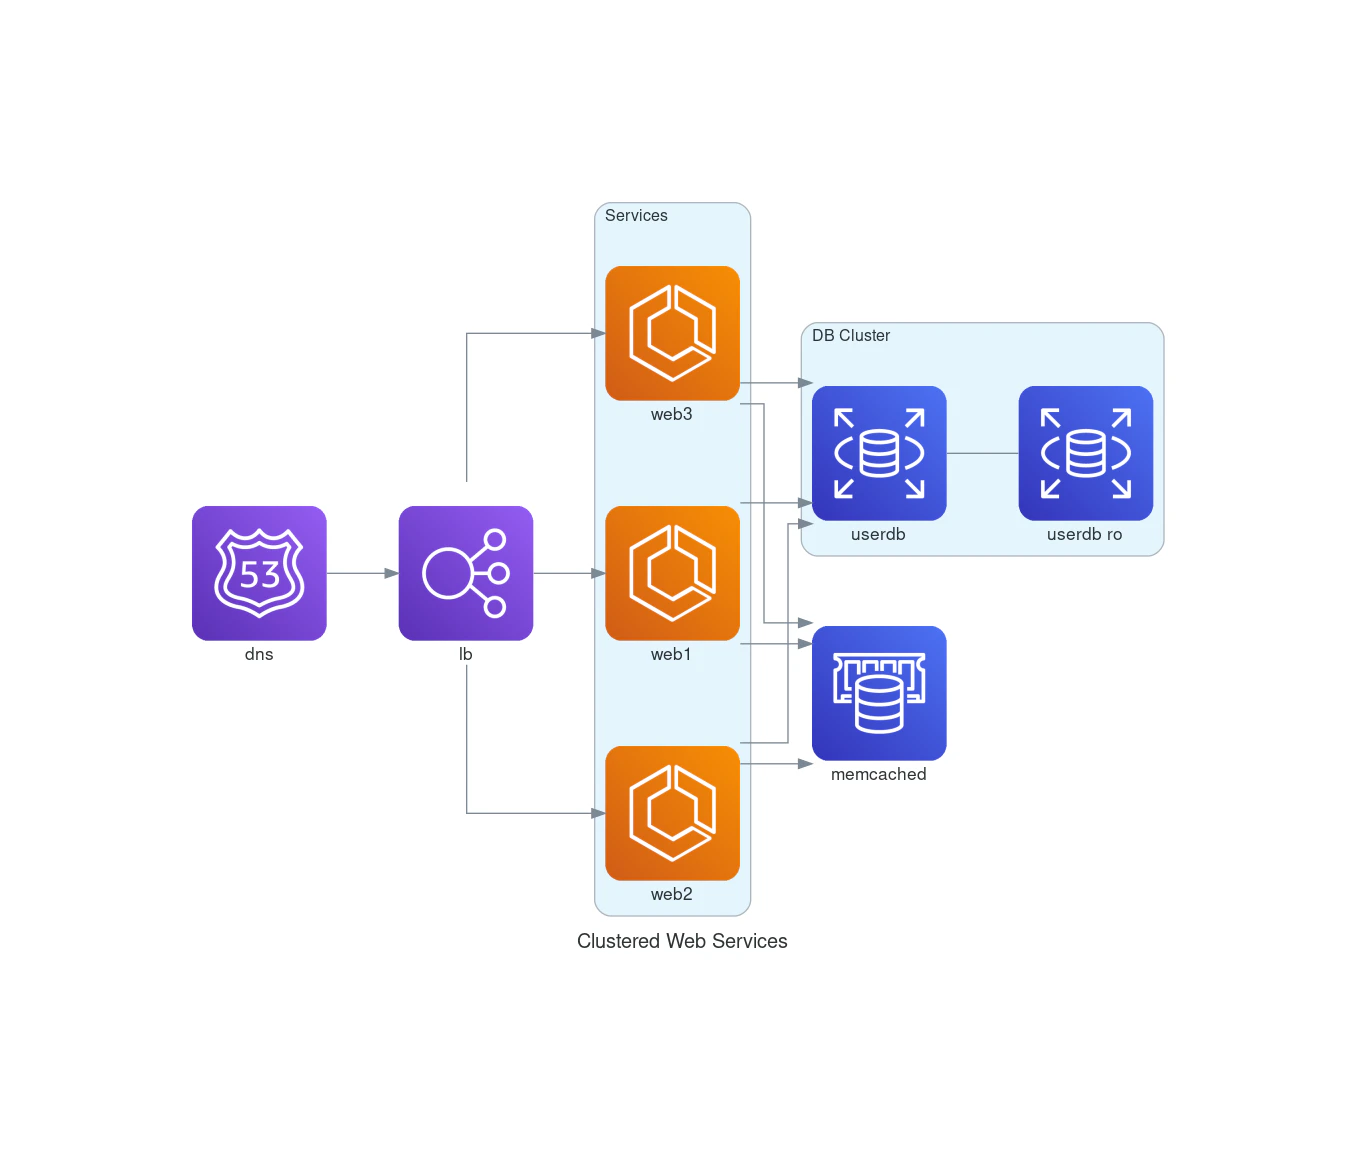
C4 Model Diagrams
The diagrams package supports the C4 model for visualizing software architecture: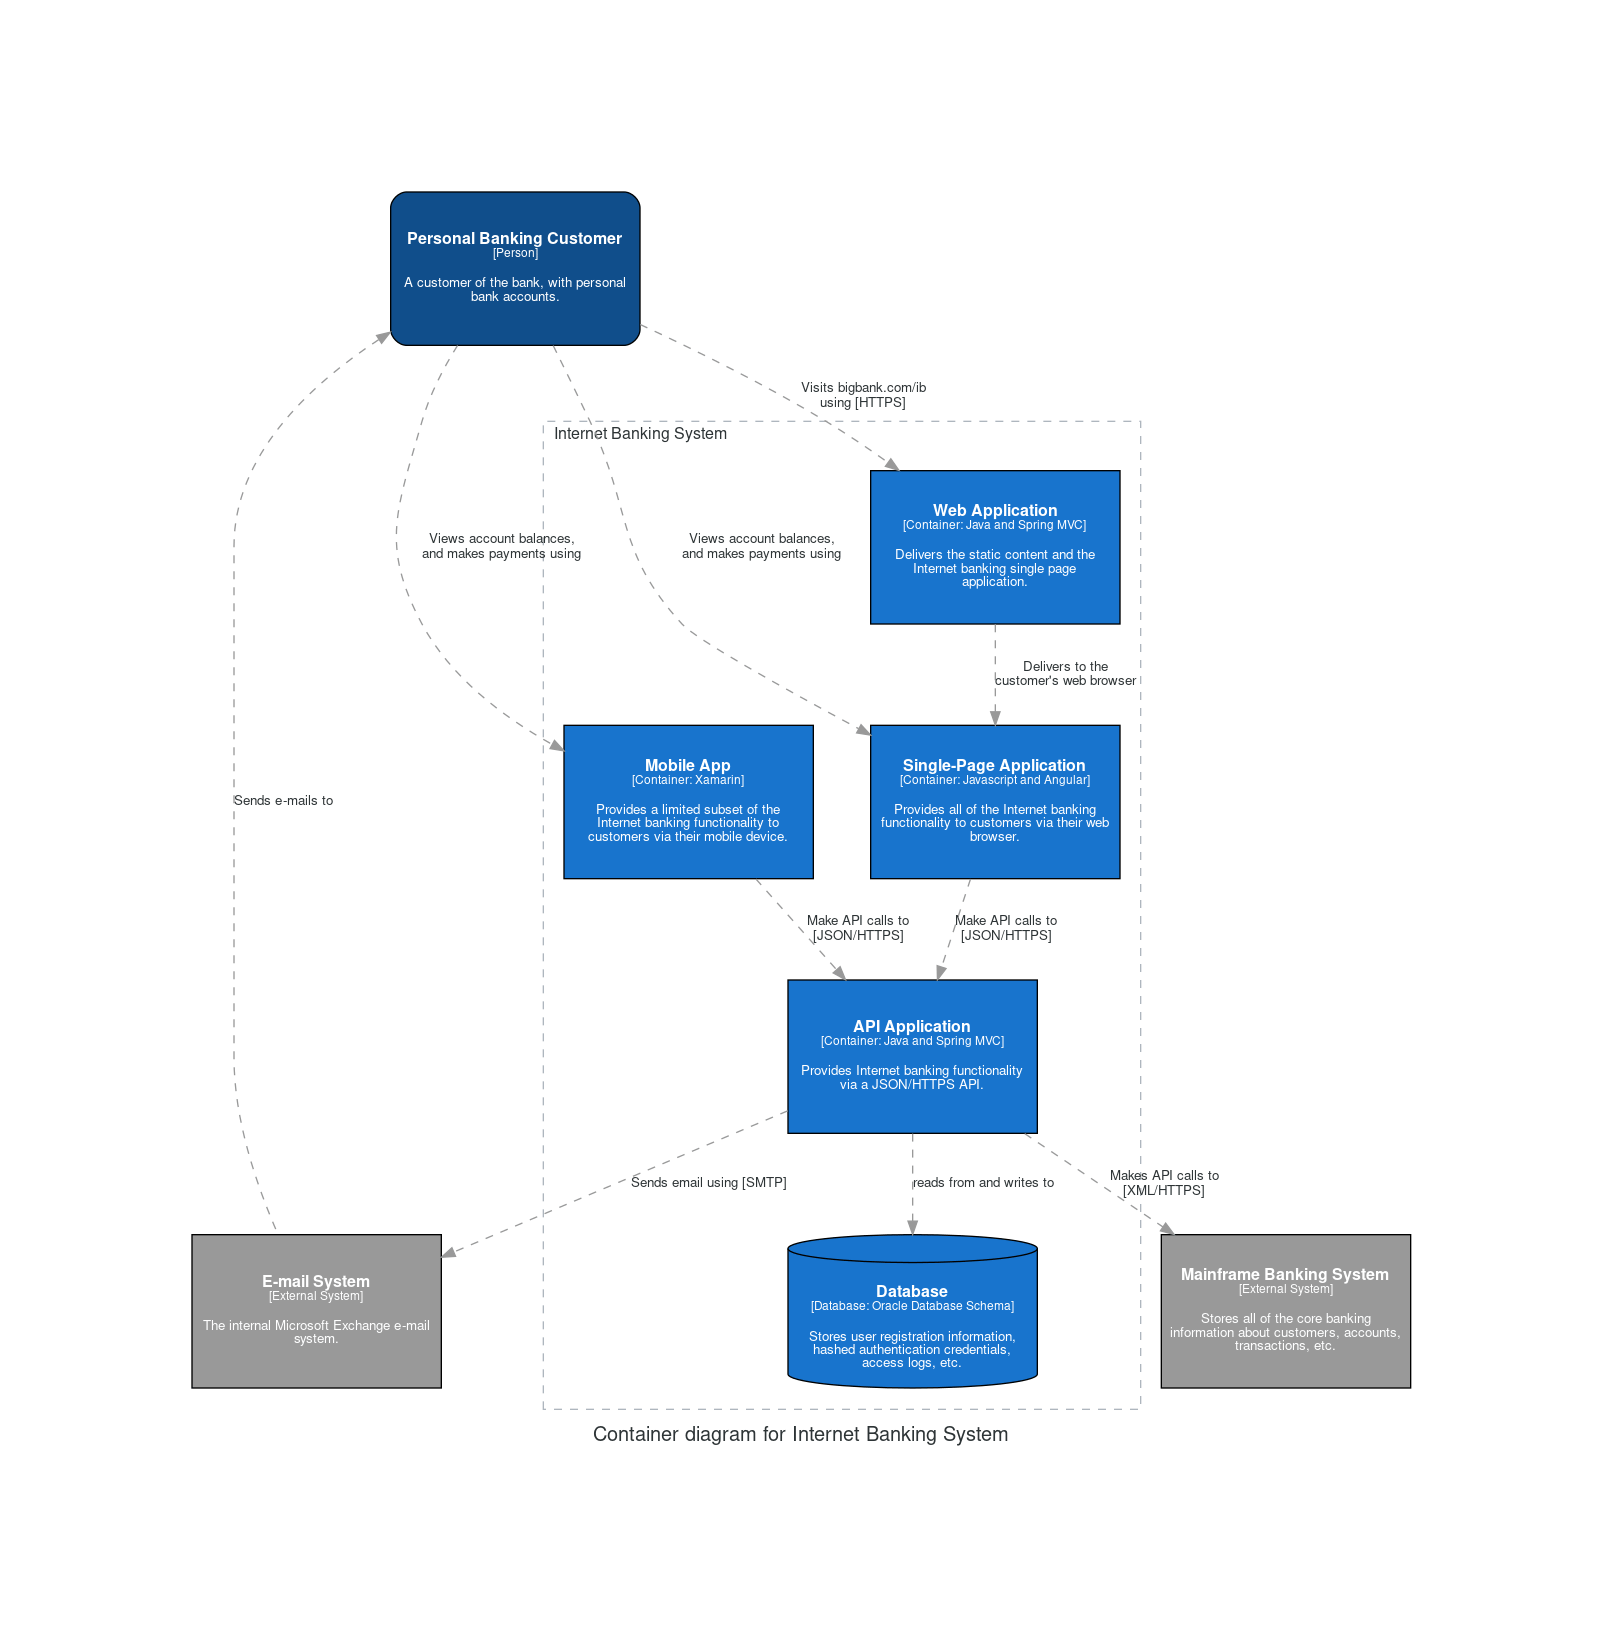
Custom Icons
You can use custom icons for components not included in the standard providers: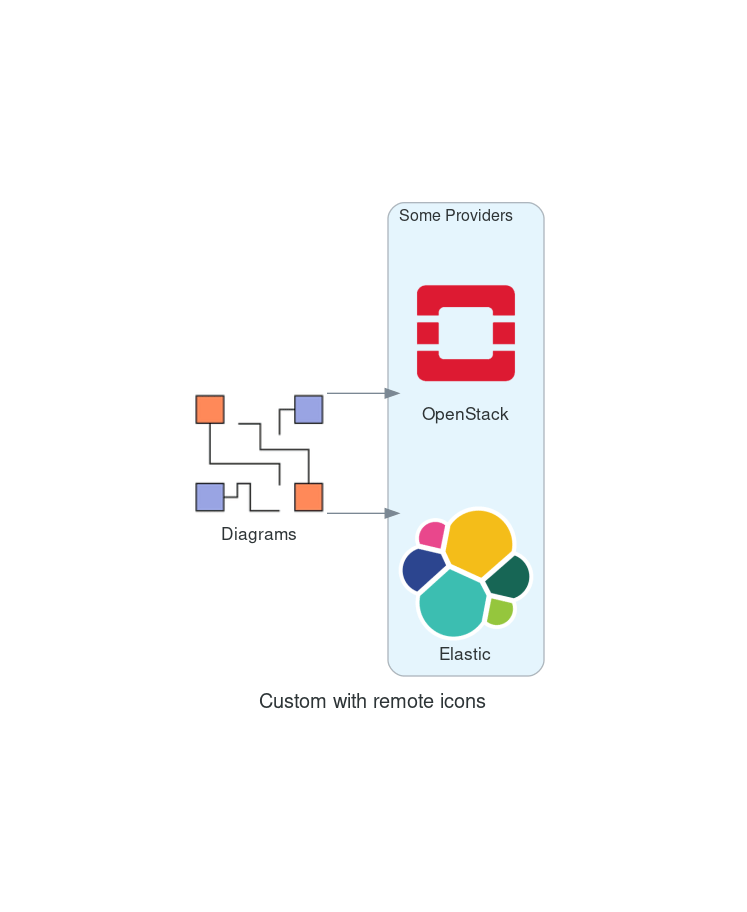
Mermaid Diagrams
For simpler diagrams that don’t require external dependencies, Mermaid provides a markdown-based syntax. Mermaid is supported natively in many documentation platforms including GitHub and Mintlify.Neural Network Architecture Example
Here’s a Mermaid flowchart showing an upcycled MoE (Mixture of Experts) block:Model Architecture Visualization
For visualizing trained model architectures (ONNX, TensorFlow, PyTorch, etc.), we recommend Netron - a viewer for neural network, deep learning, and machine learning models. Netron supports many formats including:- ONNX (
.onnx) - TensorFlow Lite (
.tflite) - TensorFlow (
.pb,.meta, SavedModel) - Keras (
.h5,.keras) - PyTorch (
.pt,.pth) - Core ML (
.mlmodel,.mlpackage)
When to Use Each Tool
Resources
Found an error on this page? Report an issue.