# COCO category names (91 categories, index 0 = background)
COCO_NAMES = [
"__background__", "person", "bicycle", "car", "motorcycle", "airplane", "bus",
"train", "truck", "boat", "traffic light", "fire hydrant", "N/A", "stop sign",
"parking meter", "bench", "bird", "cat", "dog", "horse", "sheep", "cow",
"elephant", "bear", "zebra", "giraffe", "N/A", "backpack", "umbrella", "N/A",
"N/A", "handbag", "tie", "suitcase", "frisbee", "skis", "snowboard",
"sports ball", "kite", "baseball bat", "baseball glove", "skateboard",
"surfboard", "tennis racket", "bottle", "N/A", "wine glass", "cup", "fork",
"knife", "spoon", "bowl", "banana", "apple", "sandwich", "orange", "broccoli",
"carrot", "hot dog", "pizza", "donut", "cake", "chair", "couch",
"potted plant", "bed", "N/A", "dining table", "N/A", "N/A", "toilet", "N/A",
"tv", "laptop", "mouse", "remote", "keyboard", "cell phone", "microwave",
"oven", "toaster", "sink", "refrigerator", "N/A", "book", "clock", "vase",
"scissors", "teddy bear", "hair drier", "toothbrush",
]
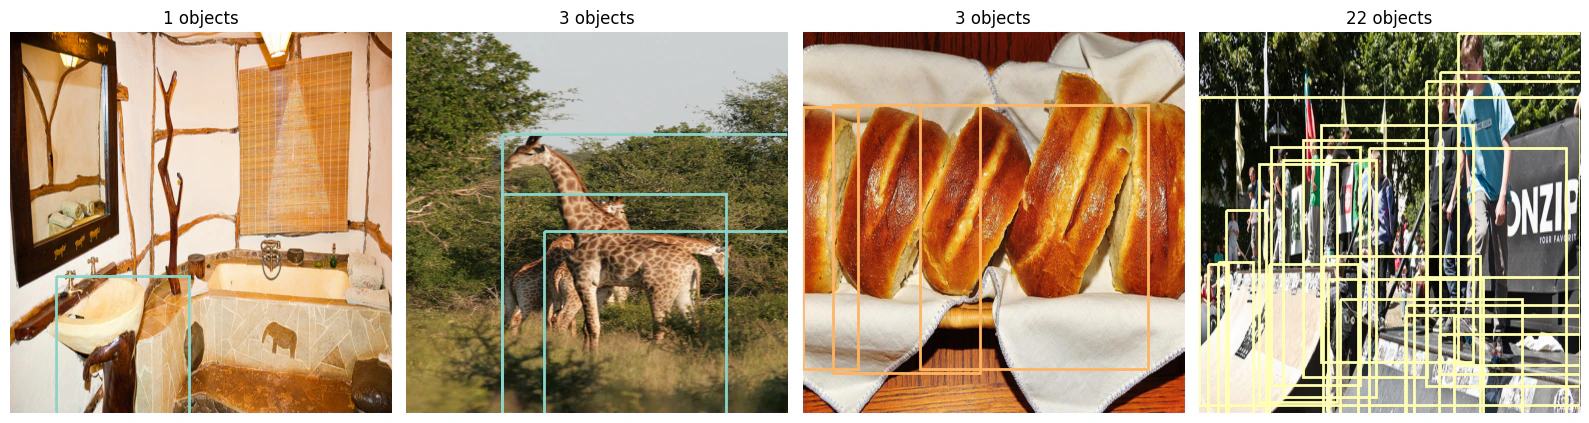
def show_predictions(images, predictions, score_threshold=0.5, max_images=4):
"""Display images with predicted bounding boxes and labels."""
fig, axes = plt.subplots(1, min(len(images), max_images), figsize=(16, 5))
if not isinstance(axes, np.ndarray):
axes = [axes]
colors = plt.cm.tab20(np.linspace(0, 1, 20))
for ax, img, pred in zip(axes, images, predictions):
ax.imshow(img.cpu().permute(1, 2, 0).numpy())
keep = pred["scores"] > score_threshold
boxes = pred["boxes"][keep]
labels = pred["labels"][keep]
scores = pred["scores"][keep]
for box, label, score in zip(boxes, labels, scores):
x1, y1, x2, y2 = box.cpu().tolist()
color = colors[label.item() % len(colors)]
rect = patches.Rectangle(
(x1, y1), x2 - x1, y2 - y1,
linewidth=2, edgecolor=color, facecolor="none"
)
ax.add_patch(rect)
name = COCO_NAMES[label.item()] if label.item() < len(COCO_NAMES) else str(label.item())
ax.text(
x1, y1 - 5, f"{name} {score:.2f}",
color="white", fontsize=8,
bbox=dict(boxstyle="round,pad=0.2", facecolor=color, alpha=0.8),
)
ax.set_title(f"{len(boxes)} detections")
ax.axis("off")
plt.tight_layout()
plt.show()