Open in Colab
Interactive section
KDnuggets Article
Published version
From covariance matrix to image whitening
The goal of this section is to go from the basics of data preprocessing to modern techniques used in machine learning. We can use code (Python/Numpy) to better understand abstract mathematical notions - thinking by coding! We will start with basic but very useful concepts in data science and machine learning like variance and covariance matrix and we will go further to some preprocessing techniques used to feed images into neural networks. We will try to get more concrete insights using code to actually see what each equation is doing. We call preprocessing all transformations on the raw data before it is fed to the machine learning algorithm. For instance, training a convolutional neural network on raw images will probably lead to bad classification performances (Pal & Sudeep, 2016). The preprocessing is also important to speed up training (see Lecun et al., 2012; section 4.3). Syllabus:- Background: Reminders about variance and covariance, generating and plotting fake data
- Preprocessing: Mean normalization, standardisation and whitening
- Whitening images: Zero Component Analysis (ZCA) for image preprocessing
1. Background
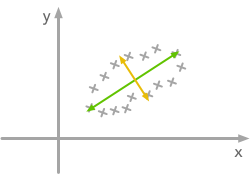
A. Variance and covariance
The variance of a variable describes how much the values are spread. The covariance is a measure that tells the amount of dependency between two variables. A positive covariance means that values of the first variable are large when values of the second variables are also large. A negative covariance means the opposite.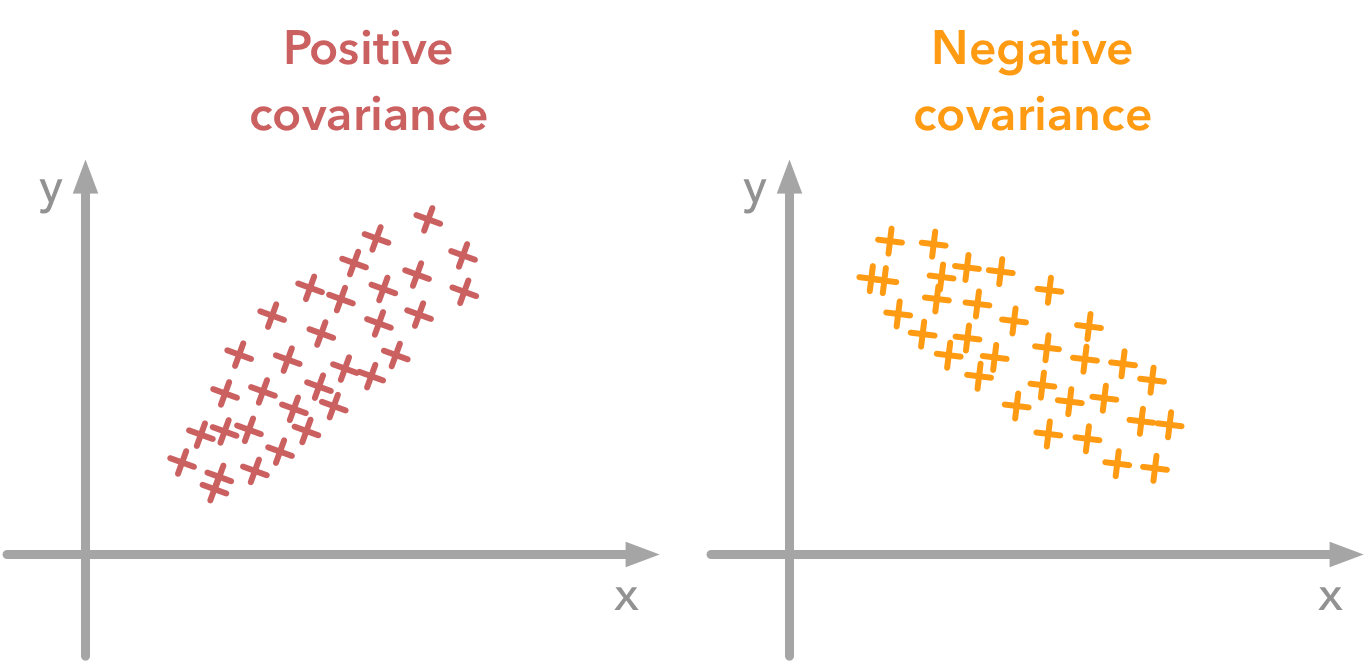
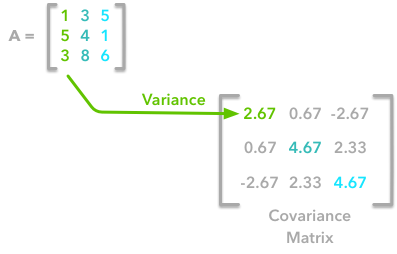
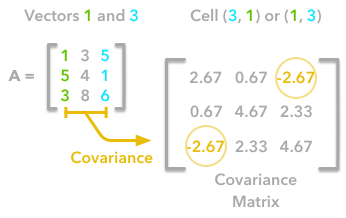
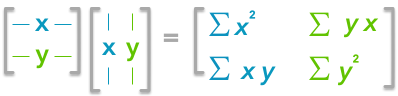
Finding the covariance matrix with the dot product
The dot product between two vectors: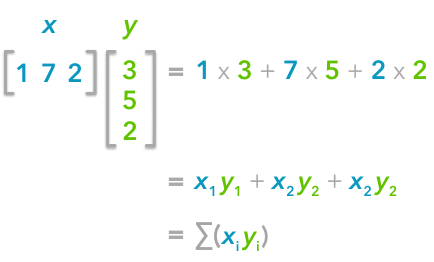
2. Preprocessing
A. Mean normalization
Mean normalization removes the mean from each observation, centering the data around 0:B. Standardization
Standardization puts all features on the same scale by dividing each zero-centered dimension by its standard deviation:C. Whitening
Whitening (or sphering) transforms data to have a covariance matrix equal to the identity matrix. Steps:- Zero-center the data
- Decorrelate the data
- Rescale the data
3. Image whitening
Zero Component Analysis (ZCA) whitening can be applied to preprocess image datasets: where are the left singular vectors, are the singular values, and is the whitening coefficient.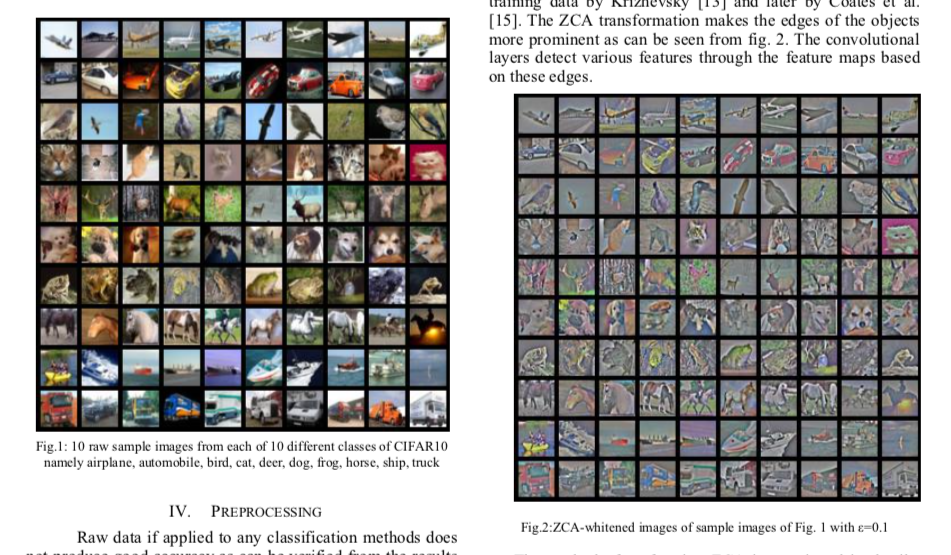
References
- Jarrett et al., 2009 - What is the best multi-stage architecture for object recognition?
- Krizhevsky, 2009 - Learning Multiple Layers of Features from Tiny Images
- LeCun et al., 2012 - Efficient BackProp
- Pal & Sudeep, 2016 - Preprocessing for image classification by CNNs
- Wan et al., 2013 - Regularization of Neural Networks using DropConnect