

import numpy as np
import matplotlib.pyplot as plt
from scipy.stats import multivariate_normal


def initialize_parameters(data, num_components):
    """
    Initializes the parameters: mixture weights, means, and covariances.
    """
    num_features = data.shape[1]
    weights = np.ones(num_components) / num_components
    means = data[np.random.choice(data.shape[0], num_components, False)]
    covariances = np.array([np.cov(data.T) for _ in range(num_components)])
    return weights, means, covariances


def e_step(data, weights, means, covariances):
    """
    The E-step of the EM algorithm.
    """
    num_samples = data.shape[0]
    num_components = len(weights)
    responsibilities = np.zeros((num_samples, num_components))

    for i in range(num_components):
        responsibilities[:, i] = weights[i] * multivariate_normal.pdf(
            data, means[i], covariances[i]
        )
    responsibilities /= responsibilities.sum(axis=1, keepdims=True)

    return responsibilities


def m_step(data, responsibilities):
    """
    The M-step of the EM algorithm.
    """
    num_samples, num_features = data.shape
    num_components = responsibilities.shape[1]

    weights = responsibilities.sum(axis=0) / num_samples
    means = (
        np.dot(responsibilities.T, data) / responsibilities.sum(axis=0)[:, np.newaxis]
    )
    covariances = np.zeros((num_components, num_features, num_features))

    for i in range(num_components):
        diff = data - means[i]
        covariances[i] = (
            np.dot(responsibilities[:, i] * diff.T, diff) / responsibilities[:, i].sum()
        )

    return weights, means, covariances


def gmm_em(data, num_components, num_iterations):
    """
    EM algorithm for a Gaussian Mixture Model.
    """
    weights, means, covariances = initialize_parameters(data, num_components)

    for _ in range(num_iterations):
        responsibilities = e_step(data, weights, means, covariances)
        weights, means, covariances = m_step(data, responsibilities)

    return weights, means, covariances


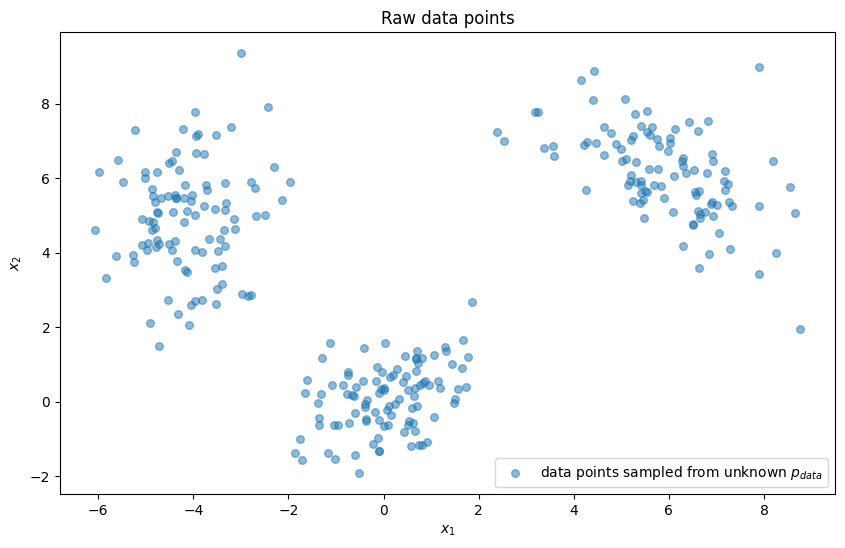
# Generate data from a true mixture of 3 Gaussians
np.random.seed(42)
n_samples = 300
cluster1 = np.random.multivariate_normal([0, 0], [[1, 0.5], [0.5, 1]], n_samples // 3)
cluster2 = np.random.multivariate_normal([6, 6], [[1.5, -0.7], [-0.7, 1.5]], n_samples // 3)
cluster3 = np.random.multivariate_normal([-4, 5], [[0.8, 0], [0, 2.0]], n_samples // 3)
data = np.vstack([cluster1, cluster2, cluster3])


def plot_data(data):
    plt.figure(figsize=(10, 6))
    plt.scatter(
        data[:, 0],
        data[:, 1],
        s=30,
        alpha=0.5,
        label="data points sampled from unknown $p_{data}$",
    )

    plt.title("Raw data points")
    plt.xlabel("$x_1$")
    plt.ylabel("$x_2$")
    plt.legend()
    plt.show()


plot_data(data)
num_components = 3  # Number of Gaussian components
num_iterations = 100  # Number of iterations for the EM algorithm

weights, means, covariances = gmm_em(data, num_components, num_iterations)

print("Weights:", weights)
print("Means:", means)
print("Covariances:", covariances)
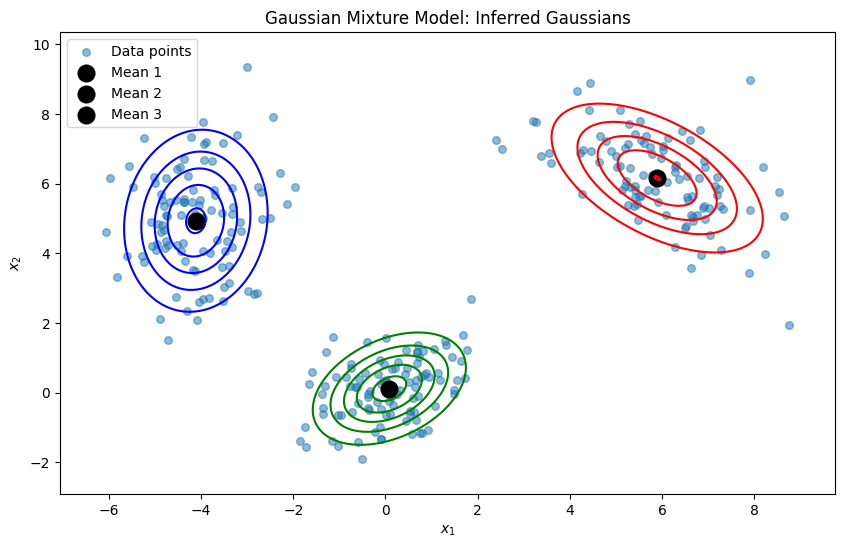
Weights: [0.33333333 0.33332184 0.33334483]
Means: [[ 5.8929956   6.1620124 ]
 [ 0.08311716  0.11705503]
 [-4.11284378  4.93617906]]
Covariances: [[[ 1.62964951 -0.83088117]
  [-0.83088117  1.41626199]]

 [[ 0.81505632  0.29757755]
  [ 0.29757755  0.76766384]]

 [[ 0.73865817  0.1067509 ]
  [ 0.1067509   2.08052127]]]
def plot_results(data, means, covariances):
    plt.figure(figsize=(10, 6))
    plt.scatter(data[:, 0], data[:, 1], s=30, alpha=0.5, label="Data points")
    colors = ["r", "g", "b", "c", "m", "y", "k"]

    x, y = np.mgrid[
        np.min(data[:, 0]) - 1 : np.max(data[:, 0]) + 1 : 0.01,
        np.min(data[:, 1]) - 1 : np.max(data[:, 1]) + 1 : 0.01,
    ]
    pos = np.dstack((x, y))

    for i, (mean, cov) in enumerate(zip(means, covariances)):
        rv = multivariate_normal(mean, cov)
        plt.contour(x, y, rv.pdf(pos), colors=colors[i], levels=5)
        plt.scatter(
            mean[0], mean[1], marker="o", color="k", s=100, lw=3, label=f"Mean {i + 1}"
        )

    plt.title("Gaussian Mixture Model: Inferred Gaussians")
    plt.xlabel("$x_1$")
    plt.ylabel("$x_2$")
    plt.legend()
    plt.show()


plot_results(data, means, covariances)
Found an error on this page? Report an issue.