
Open In Colab

Paths with the same endpoints

The transport maps and couplings section found the cheapest way to pair source points with target points. For the squared distance on the line it is the increasing map T=F1−1∘F0T = F_1^{-1} \circ F_0, and its cost is W22(p0,p1)W_2^2(p_0, p_1). This section asks the next question: how should the mass move through time? A map gives the endpoint x1=T(x0)x_1 = T(x_0) of each point and says nothing about the times in between. Every path of the form xt=x0+h(t) (T(x0)−x0),h(0)=0,h(1)=1,x_t = x_0 + h(t)\,\bigl(T(x_0) - x_0\bigr), \qquad h(0) = 0, \quad h(1) = 1, starts at x0x_0 and ends at T(x0)T(x_0). The function hh is a schedule. With h(t)=th(t) = t every point moves at constant speed. With h(t)=t2h(t) = t^2 every point starts slowly and speeds up. For increasing hh, all these paths move each point along the same segment, but at different times, so their intermediate densities ptp_t differ. The code below sets up the grids used in the rest of this section: 201 times in [0,1][0, 1] and 2001 positions in [−6,7][-6, 7].

The fluid picture

Think of ptp_t as the density of a fluid on the line and of vt(x)v_t(x) as the velocity of the fluid at position xx and time tt. This is the picture of the storm in the velocity fields section, where the wind carries raindrops. Here the field carries probability mass. A particle at xx at time tt moves with velocity vt(x)v_t(x), so its trajectory solves x˙t=vt(xt)\dot x_t = v_t(x_t). Probability mass is conserved: it is neither created nor destroyed. The total stays equal to 1, and mass that leaves one place must arrive somewhere next to it. The wind in the storm example did not have to conserve anything it carried.

The continuity equation

Conservation of mass becomes an equation once you count the mass in a fixed interval [a,b][a, b], M(t)=∫abpt(x) dx.M(t) = \int_a^b p_t(x)\,dx . Mass enters or leaves the interval only through its two ends. The rate at which mass crosses a point xx from left to right is the flux pt(x) vt(x)p_t(x)\,v_t(x), the density times the velocity. Mass flows in at aa and out at bb, so M′(t)=pt(a) vt(a)−pt(b) vt(b)=−∫ab∂x(pt(x) vt(x)) dx.\begin{aligned} M'(t) &= p_t(a)\,v_t(a) - p_t(b)\,v_t(b) \\ &= -\int_a^b \partial_x\bigl(p_t(x)\,v_t(x)\bigr)\,dx . \end{aligned} The second line is the fundamental theorem of calculus. Differentiating under the integral sign also gives M′(t)=∫ab∂tpt(x) dxM'(t) = \int_a^b \partial_t p_t(x)\,dx. The two integrals agree for every interval, so their integrands agree at every point: ∂tpt+∂x(pt vt)=0.\partial_t p_t + \partial_x (p_t\, v_t) = 0 . This is the continuity equation (Santambrogio, 2015). It links a path to a field: the field vtv_t moves the path ptp_t when the pair satisfies it. The diffusion sections later in the book add a second flux term, for mass that spreads by random motion.

Speed and kinetic energy

On the paths above, a particle moves with velocity x˙t=h′(t) (T(x0)−x0)\dot x_t = h'(t)\,\bigl(T(x_0) - x_0\bigr). The kinetic action of a path is the average squared speed of its particles, integrated over time. For these paths it factors: A=∫01E[X˙t2] dt=E[(T(X0)−X0)2]∫01h′(t)2 dt=W22(p0,p1)∫01h′(t)2 dt.\begin{aligned} A &= \int_0^1 \mathbb{E}\bigl[\dot X_t^2\bigr]\,dt \\ &= \mathbb{E}\bigl[(T(X_0) - X_0)^2\bigr] \int_0^1 h'(t)^2\,dt \\ &= W_2^2(p_0, p_1) \int_0^1 h'(t)^2\,dt . \end{aligned} The last step uses the result of the maps and couplings section: the cost of the increasing map is W22W_2^2. By the Cauchy-Schwarz inequality, 1=(∫01h′(t) dt)2≤∫01h′(t)2 dt,1 = \Bigl(\int_0^1 h'(t)\,dt\Bigr)^2 \le \int_0^1 h'(t)^2\,dt , with equality only when h′h' is constant, that is, when h(t)=th(t) = t. For h(t)=t2h(t) = t^2 the integral is ∫014t2 dt=4/3\int_0^1 4t^2\,dt = 4/3, so this schedule costs a third more than constant speed. Of all the ways of following the map TT, constant speed has the smallest kinetic action, and that action is W22W_2^2. The code below evaluates both actions.
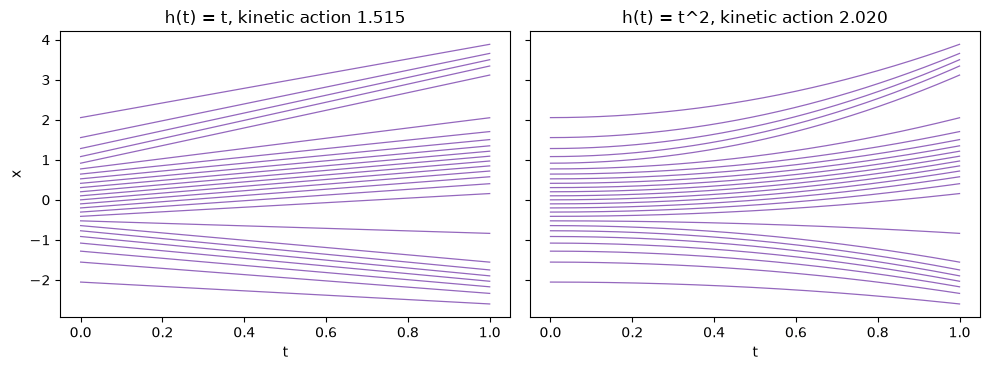
Two panels of 25 particle trajectories plotted against time. On the left, with h(t) = t, every trajectory is a straight line from its start at t = 0 to its end at t = 1, and the lines spread into three groups. On the right, with h(t) = t squared, the trajectories have the same endpoints but stay nearly flat at first and bend toward their targets near t = 1. The titles report kinetic actions 1.515 and 2.020. Trajectories of 25 source points at evenly spaced quantile levels under the same map TT. Both schedules move each point along the same segment. With h(t)=t2h(t) = t^2 the points move little before t=0.5t = 0.5 and fast near t=1t = 1.

Displacement interpolation

The constant-speed paths define a probability path. The geodesic ptp_t is the density of xt=(1−t) x0+t T(x0),x0∼p0.x_t = (1 - t)\,x_0 + t\,T(x_0), \qquad x_0 \sim p_0 . This path is called displacement interpolation (Santambrogio, 2015). Each particle moves from its own position to its target. The path is never a weighted average of p0p_0 and p1p_1. The last part of this section computes the cost of such an average. The map x0↦xtx_0 \mapsto x_t is increasing, so the change of variables formula gives the density, pt(xt)=p0(x0)1−t+t T′(x0),T′(x0)=p0(x0)p1(T(x0)).\begin{aligned} p_t(x_t) &= \frac{p_0(x_0)}{1 - t + t\,T'(x_0)}, \\ T'(x_0) &= \frac{p_0(x_0)}{p_1(T(x_0))} . \end{aligned} The formula for T′T' comes from differentiating F1(T(x))=F0(x)F_1(T(x)) = F_0(x). Because the map keeps the order of points, the CDF follows too: Ft(xt)=F0(x0)F_t(x_t) = F_0(x_0). Each particle also moves at the constant velocity T(x0)−x0T(x_0) - x_0, so the field at xx is that velocity for the source point x0x_0 that reaches xx at time tt. The code below computes all three by pushing a fine grid of source points forward.
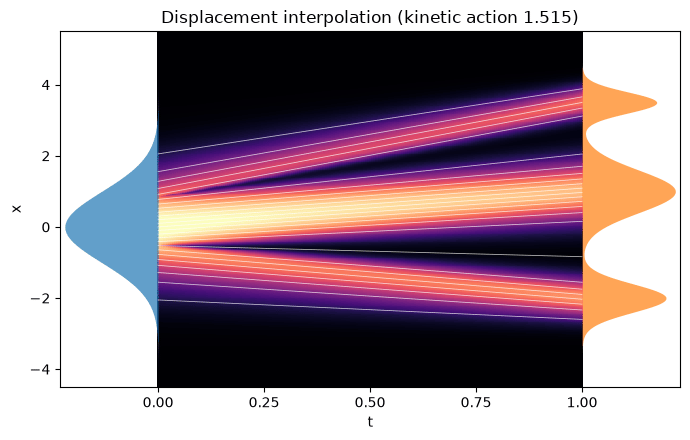
Heatmap of the geodesic path with time on the horizontal axis and x on the vertical axis. The standard normal source profile is on the left edge and the three-component target profile on the right edge. Straight white particle lines fan out from the source and form three bright bands that end at the three target components. The title reports kinetic action 1.515. Displacement interpolation from p0p_0 to p1p_1. Each white line is one particle moving at constant velocity. The single bump of p0p_0 splits into three bands right away, and each band moves straight to one component of p1p_1. The independent-pair path of the maps and couplings section narrowed before it split; this one does not.

A density path fixes its field

In 1D the continuity equation can be solved for the field. Integrate it over (−∞,x](-\infty, x]. The first term gives ∂tFt(x)\partial_t F_t(x), the time derivative of the CDF. The second gives pt(x) vt(x)p_t(x)\,v_t(x), provided the flux vanishes at −∞-\infty. So ∂tFt+pt vt=0\partial_t F_t + p_t\, v_t = 0, and vt(x)=−∂tFt(x)pt(x).v_t(x) = -\frac{\partial_t F_t(x)}{p_t(x)} . The path alone determines the field. The code below computes the geodesic field in two ways: from this formula, with a finite difference in tt, and from the particle velocities T(x0)−x0T(x_0) - x_0. The formula divides by ptp_t, so the comparison uses only the grid points where pt(x)>10−3p_t(x) > 10^{-3}. Farther out in the tails the field moves almost no mass, and dividing by a tiny density amplifies small numerical errors.
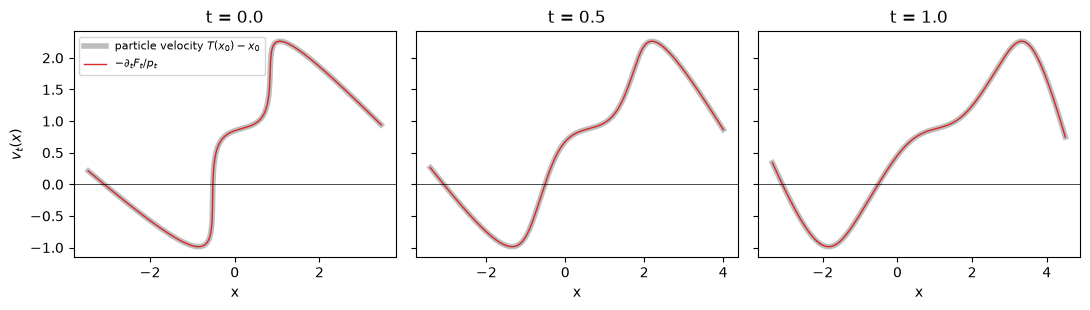
Three line plots of the geodesic field against x at times 0, 0.5 and 1. In each, a thin red curve from the CDF formula lies on top of a thick gray curve from the particle velocities. At time 0 the field rises steeply near x = -0.5 and x = 0.8. At times 0.5 and 1 the curves are smooth, ranging from about -1 to about 2.3. The geodesic field at three times, from the CDF formula (red) and from the particle velocities (gray), drawn where pt>10−3p_t > 10^{-3}. The largest difference between the two computations, printed above, is below 10−410^{-4}. At t=0t = 0 the field rises steeply near x=−0.5x = -0.5 and x=0.8x = 0.8. Source points on either side of those positions head for different components of the mixture. As tt grows the three groups move apart and the field becomes smooth. This uniqueness is special to 1D. In two or more dimensions the continuity equation reads ∂tpt+∇⋅(ptvt)=0\partial_t p_t + \nabla \cdot (p_t v_t) = 0. You can add to vtv_t any field wtw_t with ∇⋅(ptwt)=0\nabla \cdot (p_t w_t) = 0 without changing the path. A rotation about the center of a radially symmetric density is an example: it moves every particle except the one at the center, but leaves the density as it was. Many fields then move the same path, and choosing among them is part of the problem.

The Benamou-Brenier formula

Benamou and Brenier recast the static problem of the maps and couplings section as a problem about motion (Benamou & Brenier, 2000; Peyré & Cuturi, 2018). Consider every pair (pt,vt)(p_t, v_t) that satisfies the continuity equation, with ptp_t equal to p0p_0 at t=0t = 0 and to p1p_1 at t=1t = 1. The smallest kinetic energy among them is W22W_2^2: W22(p0,p1)=min⁡(pt, vt)∫01 ⁣ ⁣∫pt(x) vt(x)2 dx dt,subject to ∂tpt+∂x(pt vt)=0.\begin{aligned} W_2^2(p_0, p_1) &= \min_{(p_t,\, v_t)} \int_0^1 \!\! \int p_t(x)\, v_t(x)^2 \,dx\,dt, \\ &\text{subject to } \partial_t p_t + \partial_x (p_t\, v_t) = 0 . \end{aligned} The inner integral is the average squared speed of the mass at time tt, the same quantity as E[X˙t2]\mathbb{E}[\dot X_t^2] in the kinetic action. The minimizer is the geodesic. Its computed energy above matches W22W_2^2, and the schedules showed that following the same map at uneven speed costs more. As a second check, take a path of a different kind. The mixture path blends the two densities, pt=(1−t) p0+t p1,Ft=(1−t) F0+t F1.p_t = (1 - t)\,p_0 + t\,p_1, \qquad F_t = (1 - t)\,F_0 + t\,F_1 . Its field comes from the 1D formula. Its particles follow from the same formula: along a trajectory, ddtFt(xt)=∂tFt+ptvt=0\frac{d}{dt} F_t(x_t) = \partial_t F_t + p_t v_t = 0, so a particle keeps its quantile level and xt=Ft−1(F0(x0))x_t = F_t^{-1}\bigl(F_0(x_0)\bigr). The code below computes the field, the particles and the kinetic energy of the mixture path.
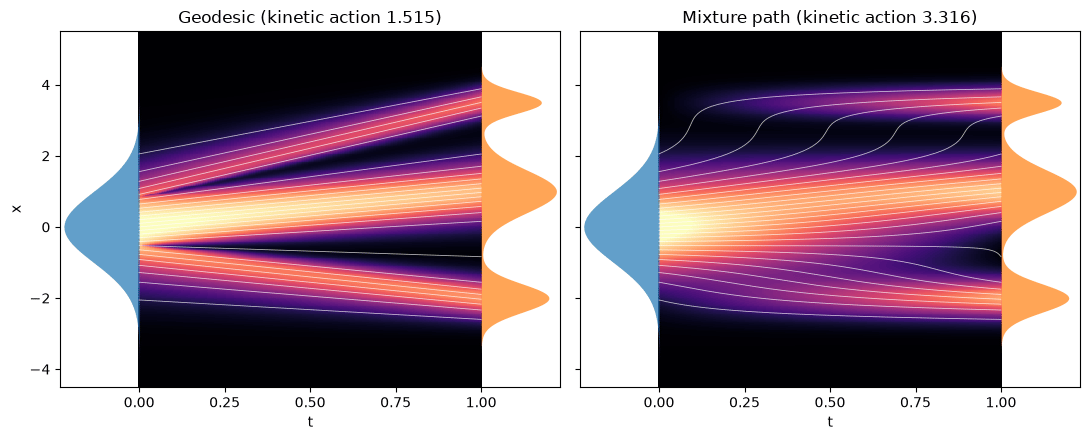
Two standard transport heatmaps side by side. The geodesic on the left shows straight particle lines fanning into three bands, with kinetic action 1.515. The mixture path on the right shows the source bump fading while the three target bumps brighten in place. Its particle lines stay nearly flat, then jump quickly across dark gaps into the upper and lower components. Its title reports kinetic action 3.316. Left, the geodesic. Right, the mixture path (1−t) p0+t p1(1 - t)\,p_0 + t\,p_1, with particles that keep their quantile levels. Both paths join the same endpoints. The computed energy of the mixture path is more than twice W22W_2^2. The sum leaves out the grid cells where pt≤10−3p_t \le 10^{-3}, so the true energy is larger still. The energy is high because this path never moves the source bump. It fades the bump out where it is and fades the target components in where they are. Particles must keep their quantile levels, so a particle bound for the upper or lower component waits and then crosses a nearly empty gap in a short time. A short crossing means a high speed, and the energy grows with the square of the speed.

From the geodesic to flow matching

Flow matching works with the same objects: a probability path, the field that moves it, and the continuity equation that links them. It picks a path that is easy to sample and to learn from samples, and that path is not in general the geodesic. The flow matching section states the method in general, and the 1D mixture section runs it on this mixture and measures its kinetic action against W22W_2^2. Key references: (Benamou & Brenier, 2000; Santambrogio, 2015; Peyré & Cuturi, 2018)

References

  • Benamou, J., Brenier, Y. (2000). A computational fluid mechanics solution to the Monge-Kantorovich mass transfer problem. Numer. Math. (Heidelb.). DOI
  • Peyré, G., Cuturi, M. (2018). Computational Optimal Transport. arXiv [stat.ML]. DOI
  • Santambrogio, F. (2015). Optimal transport for applied mathematicians – calculus of variations, PDEs and modeling.

Found an error on this page? Report an issue.